How to Analyze Affiliate Data Like a Pro (and Why It’s Important)
Last updated on May 9, 2018 21 min read
Introduction
Wanna know a life-changing, jaw-dropping truth:
Excel is the best thing you’ll ever be able to explore in this god forsaken, barren land we call earth!
Don’t forget that info is power.
This power is the result of a super thorough analytical mindset.
You must know everything.
Every detail is a giant step for you to know more and become better.
The ability to know everything comes through Excel and its many awesome tools for data analysis.
In this article, us Excel experts are gonna explore some of the most crucial data parameters you must bear in mind to succeed.
We’re gonna go through all the relevant details, with a special focus on what’s gonna help you be the king of media buying analysis.
We will refer to the most important Excel tools and show you how to use them for max efficiency.
Ready for a post about the best Excel tips and tricks for affiliates?
Prepared for some awesomely advanced Excel tricks that will optimize your media buying experience?
Let’s begin our journey through affiliate marketing databases and learn some super cool Excel tricks!
The Importance of Affiliate Data
In your life, you’ll be tasked with making a bunch of relevant decisions.
Where should you buy groceries if you want the cheapest supermarket prices?
Which restaurant to pick for a lovely night out with your boo?
How do you deal with all these decisions and their ramifications?
Info.
You always need information to decide.
How do you get this info?
By analyzing data.

This is why a complete dataset makes all the difference.
Quality data usually means quality decisions.
Why not always?
Because it depends on the way that data is actually analyzed.
Later on, we’ll go through the data-analysis best practices.
For now, though, we’re gonna focus on datasets.
Which question should we ask ourselves?
“Which is the most relevant data to know in the media buying game?”
Ready for a rundown of important affiliate metrics?
Let’s go check them so that you can be ready for the best tips and tricks for Microsoft Excel!
Affiliate Metrics: Data Becomes Real
You know as well as any other affiliate marketer out there that affiliate metrics are remarkably important.
They allow you to measure results and get the data you need to optimize faster like a master!
Ready to understand which are the metrics for affiliate marketing that you need to check to analyze that sweet data?
Check these affiliate metrics!
Clicks
The quantity of clicks you received in a banner.
Visits
The quantity of visits on the prelander or landing page.
Costs
The costs you must pay to generate the number of clicks/visits you have.
It’ll always be a relation between volumes and the costs per click/impressions/visits you have.
Conversions
The number of conversions/subscriptions you get from your traffic.
Revenues
The revenues you’ve gotten from the conversions/subscriptions your traffic has generated.

It’s always a relation between the CPA/payout and the number of conversions.
Margin
What you’ve really earned.
This is your profit.
The revenues minus the costs.
This is the info you need if you want to start.
What?
You wanna dive deeper?
Then we’ll have to start exploring a real special little something:
Affiliate data details.
The Difficulty of Analyzing Data in Affiliate Marketing
You’re analyzing data.
The vibe is right, you seem up for it, it’s all going your way.
But wait!
What’s the main difficulty you experience when analyzing data in affiliate marketing?
There are three main issues that come about.
Let’s check each one in detail, shall we?
Three Data-Related Difficulties
Volumes
Now here’s something that can be super hard.
The quantity of data can make sure that tracking volumes is a complicated endeavor.
If you start by working on a couple of campaigns, then maybe you can follow their evolution.
What if you begin adding campaigns willy-nilly?
Tracking all the volumes is gonna get mighty complex.
The difficulties will start troubling you.

You’ll have a hard time understanding which campaigns are losing money and where.
What to do?
Follow our advice and check a couple of tools.
Tracking Platform
This is where you can configure the campaigns and receive all the information you need to calibrate optimizations like a master.
You can track conversions made by country, carrier, operating system, device, browser and much more.
Learn More: The Best Affiliate Tracking Platforms to Know in 2018
Excel
You’ll need to analyze huge databases.
This means you’ll need a tool like Excel to help you.
In this article, we’ll show you how to use it properly for you to really take max advantage.
Details
If you want to succeed in this industry, you need to go into detail.
You must thoroughly analyze each parameter and its many correlations.
You’ll need to know your most profitable campaigns and where you should focus your attention.
Look at the websites and understand which ones are golden.
Check operating systems with a high performance and others which aren’t as well known.
Look for the specific niches in which you can increase your profits.

Correlations
With so many parameters, it’s only natural that there are many correlations.
One of the most obvious correlations is the one which occurs between the iOS operating system and iPhone/iPad devices.
iOS not showcasing the best results?
It may be due to one of those devices.
There are lots of unexpected correlations.
For example, don’t expect that certain sets of banners will only work for a particular website.
What to do?
Go into detail.
Check different correlations that may appear.
For that, you need a tool that allows for an easy and super fast analysis.
Is it Excel, you ask?
You know it, bro!
How to Analyze Data in Media Buying Campaigns
Do you wanna analyze media buying campaigns like a master?
Then it’s super important to have a great tracking solution or at least to configure the postback correctly.
It’s the only way for you to get relevant and highly-valuable data to analyze.
Let’s say that you have one of these tools implemented.
Then it’s gonna be easier for you to effectively optimize your data using Excel.
Excel allows you to match, configure, relate and organize data.
This will allow you to come up with conclusions.
But how can you analyze a media buying campaign?
Check some clues!
Analyzing Campaigns
Overview
First thing to do?
Get an overall view of your campaigns.
Which ones are losing, which ones are mighty profitable and which ones need your immediate attention.
How to do it?
Just match the campaign’s revenues and the campaign’s costs per day.
You’ll have an idea about how your investment is actually going and what’s the effective impact of your actions.
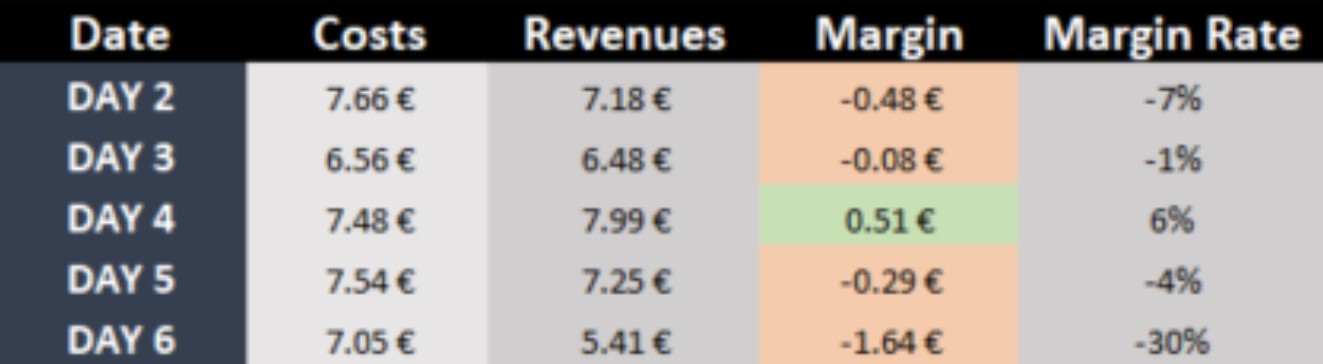
Look for margin rates.
It’ll help you control your investment and to know when to stop or invest more.
First, go and check the campaign which appears to be losing a whole lotta money.
Then, take quick and swift action.
This will have a major impact on the total margin.
Now’s the moment to go into detail.
Choose a campaign and analyze all the parameters thoroughly.
Check for heavy losses, websites, devices, operating systems, etc.
Banners
We may begin the optimization by looking at banners.

Always have 3 banners.
Why?
Because you should be following the optimal rule of banners.
Two good banners and one that you wanna test.
See the image above?
We believe it’s easy to see that the banner which has the highest CTR is also the one with the lowest eCPA.
It isn’t always the case.
Even so, it’s frequent that there actually is a correlation between both.
What to do?
Stop banner 3 and add a new one to be tested.
Pro tip:
Always remember that banners have no correlation with other parameters!
Websites

Let’s imagine your campaign has a payout of 0.85€.
Looking at the eCPA values, it’s easy to see that SITE 5 is the one you should stop.
Devices VS Operating Systems
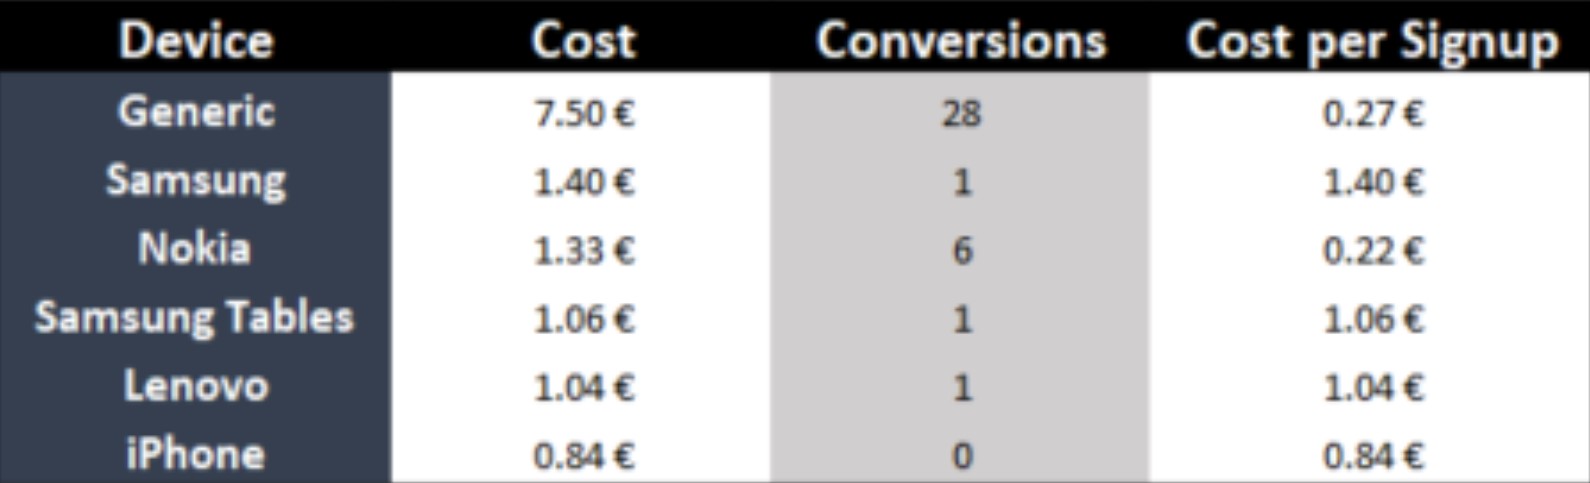

In these two images, you can see that Android is correlated with several devices.
Let’s suppose that the payout is 0.50€.
It means that – with an eCPA of 0.53€ for Android – you’re losing money.
Should you stop Android?
No.
Why not?
Because of correlations.
Samsung, Samsung tablets and Lenovo are the sources of the bad performance.
Stopping these will make Android profitable and the campaign positive.
By analyzing the correlations, you’ve made your campaign profitable.
There are also positive correlations.
Check your best targets, the correlation between them, and then target those specific ones by creating a new campaign.
Finally, take a look at the prices of your campaign.

On day 6, there’s a decrease of impressions and a CPM increase due to competition.
In this case, it’s clear that someone has gotten your position, therefore decreasing both your volumes and traffic quality.
Since your CPM increased, someone has been able to get a position below you.
The result is an increase of the eCPA, which may turn a profitable campaign into a black hole.
These analyses are fundamental if you want to turn your campaigns into gold mines.
With Excel, you can improve your efficiency and reach the next level.
How to use Excel to Analyze Data in Media Buying Campaigns
Excel is an extremely useful tool for data analysis.
If you don’t want to get involved with programming, then Excel really is both the fastest and easiest tool for you to use.
Anyone can learn how to explore Excel.
It’s just a matter of getting used to the functions and their specific goals.
Why is Excel the belle of the ball?
Here are three good reasons why!
- Easier to analyze data
- Great at summarizing in different ways
- Useful for you to compare building a pivot table report instead of having to go through the process of building the same report manually
Boring, indeed!
Mobile marketing gets bigger, more popular, and more interesting by the minute.
As you get into it, you’ll understand that there are a lot more parameters and variables to be tracked and analyzed.
Through the use of pivot tables, you can perform a successful A/B testing and also split test offers.
There are even some Excel Pivot table tricks you can use to maximize success.
Excel will basically help you create cross tabulations of keywords.
Pivot Tables provide you with a versatile way to handle all those extra columns that you have to deal with in your reports.
Then, all this precious info will be processed through pivot tables in order to optimize your campaigns.
Pivot tables are terrific to analyze data on the fly without building a full program.
This really is one of the best tricks in Microsoft Excel, brother!
You don’t even have to know any Excel formulas.
The name “Pivot Table” somehow makes it sound like it’s some advanced gizmo only reserved for Excel wizards.
It’s actually quite the opposite.
It’s an easy, fast, yet powerful way for marketers who aren’t familiar with Excel to quickly analyze large amounts of data.
Are you someone who believes Excel gives you a general headache?
We both promise this experience is gonna be free of agonizing pain!
Compare building a pivot table report to the process of building the same report manually.
How?
Check the video below!
Excel Features You Can Use to Analyze Data
Analyzing your data used to be quite the boring process.
It was a ton of work.
With Excel, though, everything changes for the better.
Indeed, with this amazing tool, it’ll only take a few steps for you to analyze like a pro.
You can instantly create different types of charts, including line and column charts, or add miniature graphs.
You can also apply a table style, create Pivot Tables, quickly insert totals, and apply conditional formatting.
Amazing!
So many cool tricks in Excel, so little time!
Here’s a neat trick we’ll teach you.
Trick – First Part
Select the cells that contain the data you want to analyze.
Trick – Second Part
Click the Quick Analysis button that appears at the bottom right of your selected data (or press CRTL + Q).

Which analytical feature should you use?
If you’re not sure which analytical option to pick, here’s a quick overview.
Analytical Tool Overview
Quick Analysis
In the “Quick Analysis” gallery, select the tab you want.
For example, formatting lets you highlight parts of your data by adding things like data bars and colors.
This lets you see high and low values, among other things.

Charts
Excel recommends different charts, based on the type of data you’ve selected.
If you don’t see the chart you want, click on “More Charts”.

You might notice that the options you can choose from aren’t always the same.
That’s because the options change based on the type of data you’ve selected in your workbook.
Totals
Totals allow you calculate the numbers in columns and rows.
For example, the “Running Total” inserts a total that grows as you add items to your data.
Click the little arrows on the right and left to see additional options.

Tables make it easy for you to filter and sort your data.

Sparklines are like tiny graphs that you can show along your data.
They provide you with a quick way to see trends.

Best Excel Shortcuts for Data Analysis
There are hundreds of Excel shortcuts and tricks for you to explore.
The problem with this is that it can become overwhelming for you to have to know them all by heart.
You can’t possibly absorb 233 new shortcut keys and start using them.
That’s why we’ve got you covered, bro!
The following sections cover some of the best shortcut keys.
Try to incorporate a new shortcut key into your Excel routine every week.
Prepared for a lesson about the best tricks in Excel?
Dive into it!
Excel Shortcuts List
Move Quickly
This is one of the best Excel shortcuts tips and tricks.
Let’s understand how to move quickly among worksheets.
Ctrl + Page Down jumps to the next worksheet.
Ctrl + Page Up jumps to the previous worksheet.
Let’s pretend that your workbook has 12 worksheets named Jan, Feb, Mar, . . . Dec.
If you’re currently on the Jan worksheet, hold down Ctrl and press Page Down five times to move to Jun.
Great, isn’t it?
It really is one of those awesome Excel tricks for you to explore.
Jump to the Bottom
Jump to the bottom of data with Ctrl+Arrow
As long as there are no blank cells in your data, just press Ctrl+Down Arrow to move to the last row in the data set.
Use Ctrl+Up Arrow to move to the first row in the data set.
Quick and easy!
Keep reading for some more useful tricks in Excel.
Current Region
This is one of the most important and useful Excel tips and tricks for beginners.
Select the current region with Ctrl+*
Press Ctrl * to select the current range.
The current range is the whole dataset, in all directions from the current cell until Excel hits the edge of the worksheet or a completely blank row and column.
Let’s say you’ve just selected A2:J987654 but you’re staring at the bottom-right corner of your data.
Press Ctrl + Period to move to the next corner of your data.
Since you’re at the bottom-right corner, it will take two presses of Ctrl + Period to move to the top-left corner.
Even though this moves the active cell, it doesn’t undo your selection.
Popping Open the Right-Click Menu
More useful Excel tricks?
Go for it!
Pop open the right-click menu using Shift + F10
Pressing Shift + F10 opens the right-click menu.
Use the up/down arrow keys to move to various menu choices and the right arrow key to open a fly-out menu.
When you get to the item you want, press Enter to select it.
Time-Stamp
Date-stamp or time-stamp using Ctrl shift ; or Ctrl shift :
Here’s an easy way to remember this shortcut.
What time is it right now?
It’s 11:21 here.
There’s a colon in the time.
Press Ctrl+Colon to enter the current time in the active cell.
Note that this is not the same as using =NOW() or =TODAY().
Those functions change over time.
These shortcuts mark the time or date in which you pressed the key and the value does not change.
Neat, right?
Another one of those splendid tricks for Excel you have to explore.
Last Task Repeat
Repeat the last task with F4.
Let’s say you’ve just selected a cell.
Here’s what happened next:
Home, Delete, Delete Cells, Delete Entire Row, OK.
You need to delete 24 more rows in various spots throughout your data set.
Select a cell in the next row to delete and press F4, which repeats the last command but on the currently selected cell.
Select a cell in the next row to delete and press F4.
Before you know it, all 24 rows will be deleted.
That’s right!
You didn’t have to click on Home, Delete, Delete Cells, Delete Entire Row, OK 24 times.
The F4 key works with 92% of the commands you’ll use.
Try it.
You’ll love it.
It’ll be obvious when you try to use one of the unusual commands that can’t be redone with F4.
Simple, right?
Now that’s one of the most useful Excel spreadsheet tricks for you to dive into!
Dollar Sign
Add dollar signs to a reference with F4.
When you’re entering a formula and you need to change A1 to $A$1, click F4 while the insertion point is touching A1.
You can press F4 again in order to freeze only the row with A$1.
Press F4 again to freeze the column with $A1.
Press again to toggle back to A1.
The Most Important Excel Formulas You Need to Know to Analyze Data
Ready to use the most famous formulas like a pro?
Need some Excel formula tricks from these two masters?
Pay attention, then!
VLOOKUP
This is a blessing for any mobile marketer.
It’s one of the best tricks on Excel!
This incredible function is great for comparing and connecting different sets of data.
Basically, this formula will ascertain whether a given value from one table exists in the first column of another table, and then return a value from the second table.

Tip:
Don’t forget to lock the range of the second table.
This is a common error when copying this formula.
CONCATENATE or &.
This is pretty useful.
It’s one of those Excel sheet tricks everyone should know.
It comes in handy when you’re creating different keyword lists or adding tracking parameters to URLs:
Tip:
We personally prefer using the “&” symbol.
Why?
Because it’s shorter than typing a full “concatenate” formula, but does the same exact thing.

LEN
This is great when you’re writing for a banner.
That’s why it’s one of the most popular Excel tricks and shortcuts for affiliates.
Simply put this formula next to your description cells.
What will happen?
It will tell you when there is more room available, or when it’s over the character limit.

Text to Columns
We find this Excel magic trick to be super useful, especially when we work with destination URL lists.
It’s one of those Excel spreadsheet tips and tricks that you need to grasp!
Let’s say you’ve got a URL report and that you’d like to analyze the performance per unique URL.
However, every destination URL has a unique parameter attached.
Check the image below to see magic happen.

Were we right or not?
See?
This is one of those cool Microsoft Excel tricks everyone should know.
Examples of How to Analyze Data Using Excel
You’ve checked all these amazing Excel tricks and awesome examples.
Now, what?
It’s time to put these new Excel tricks into practice.
Doing mobile affiliate marketing?
Then you know as well as we do that there are a lot of variables which can be tracked.
You can track brands, models, carriers, websites and so on.
Imagine you had amazing data about affiliate marketing.
It represented the traffic an affiliate had sent to an offer.
They want to find what they could do with the data to find the campaign’s best-converting segments.
As previously mentioned, Pivot tables will allow you to easily analyze this data.
There are a bunch of Excel pivot table tips and tricks for you to know.
Step One
Select all, table.

Step Two
Insert/Pivot Table/OK

Step Three
In any pivot table, you need to fill the box with the corresponding variable.
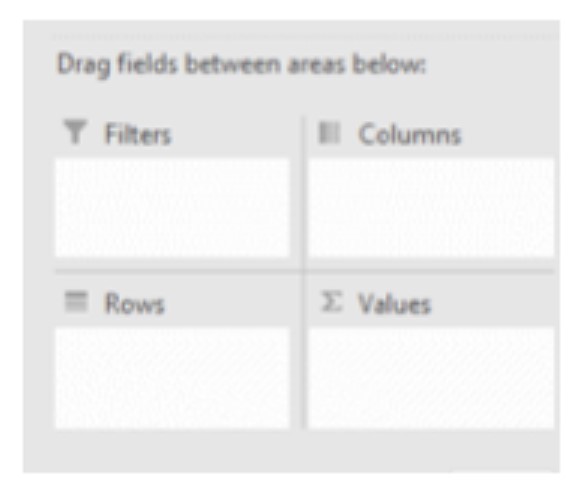
a) Filter – pre-selection of what you want
b) Rows – for your x-axis
c) Columns – for your y-axis
d) Values
§ Count
§ Sum
§ Max
§ Min
§ Average
Select the field you want to see in the row fields area.
In this case, you’ll select Campaign.
This is what you want to analyze.
For the columns, press clicks, conversions, and revenue.
Step Four
After this, you need to change the format of the cells accordingly.
Since the revenue isn’t in euros, you need to select the column/format and insert the currency.
Step Five
Wanna check one of the best Excel tricks and tips?
Keep reading!
Imagine you want to analyze CellFlirt – mobile T-Mobile campaign in more detail.
You also wanna analyze its top-converting brands.
It has 27 conversions and 162€ in revenue.
You want to select the field that it’ll open into.
Click “brand”.
It adds all the brands for the campaigns in the row section.


The brands will appear for all the campaigns.
Even so, we only want to analyze that specific one.
How to go about it?
Simple!
Select all/options under pivot table/tools, and collapse the entire field.
After that, just hit the plus button of the campaign you want.

Since you’re optimizing conversion rates, you want to add a calculated field because the conversion rate isn’t available in the data as it wasn’t calculated.
To do so, insert calculated field & format accordingly, after selecting the pivot table.
Formula = conversions (insert field) /clicks (insert field)


The brands Sharp & Softbank have high conversion rates.
The next step would be to insert that field on the report filter and only select those two to pinpoint them.
In order to conclude the analysis, press SubID.
It shows you the ads which have performed best for those two specific brands.

If you go deeper, you can see that ads 23, 19, 13, 22 are performing better.
Ad 10 is performing poorly.
What to do?
You should pause that ad in those two brands.
Now is this one of the coolest Microsoft Excel tricks or what?
Conclusion
Enjoyed these Microsoft Excel tips and tricks?
Think you know so many great Excel tricks that your affiliate marketing colleagues are gonna feel sad?
Spread the word on these neat Excel tricks, bro!
You know everything you need.
Working on Excel involves a lot of copy-pasting, cleaning, formatting, and calculating.
You can do it all manually, of course.
But you can read up, learn the rules of the game, and use Excel’s mighty powerful functionalities in order to become much more efficient.
The tips that we’ve shown in this article will increase the efficiency of your analysis.
More importantly, they will also make sure you come up with better conclusions.
The actions that you’ll take after coming up with your conclusions will have a huge impact on the performance and profits of your campaigns.
Performance. Metrics. Improvement. Success.
This is what knowing the best Excel tricks is all about.
Use this master article, keep checking the most useful Excel tricks, and become an Excel pro who uses this super cool tool to increase affiliate marketing revenues.
Cheers!
See Also:
- Affiliate Marketing Metrics: Which Ones Should I Check?
- 5 Most Common Mobile Pre-Landers That Convert
- How to Create Killer Affiliate Landing Pages in 2018
- Mobile CPA Ecosystem: Where This Story Begins


These SEO Chrome extensions to make your work easier are gonna be everything you'll ever need to make your SEO game become the best of all time!

Understand what is an ICO and how this remarkable technology is changing the landscape of business all over the known world!

AdvertisementStill struggling to find the best offers because you know you wanna make money faster like a real master? Lost…