The Semrush Ad Toolkit Guide: What Every Media Buyer Should Know
Last updated on October 20, 2025 22 min read
As a media buyer, you need to make smart choices with your advertising budget. Every dollar you spend needs to bring results. This means you need to understand what works in your market before you spend your money.
Semrush’s advertising tools give you the information you need to make smart buying decisions.
You don’t have to guess which keywords to use or wonder which ads might work. Instead, you can see exactly what your competitors are doing across search, display, and social media.
This guide explains SEMrush’s three main advertising tools. You’ll learn how to find competitor strategies, spend your media budget better, and find opportunities that others miss.
What You’ll Learn in This Guide
- Complete walkthrough of Semrush’s Advertising Research tool to spy on competitors’ search ads, keywords, and budgets
- Step-by-step guide to using AdClarity to see the exact display and video ads your competitors are running and where they place them
- Tutorial on Social Toolkit to discover what social media content gets engagement before you spend money on ads
- Smart advice for spending your advertising budget based on what competitors are actually doing with their money
- Tips on how to turn competitor research into actionable strategies with several proven techniques for your own campaigns
Using Search Advertising Insights to Win at Paid Search Campaigns
Search advertising is the foundation of most media buying strategies. You catch users at the exact moment they’re looking for solutions.
When you understand how competitors approach paid search, you get a big advantage in:
- keyword selection
- budget planning
- ad copy improvement
…and more.
Semrush’sAdvertising Research tool gives you this information with great detail.
But before you start building your own paid campaigns, it’s smart to see what your competitors are doing with their advertising money. Understanding how much they spend and where their traffic comes from gives you valuable insights that can save you time and money.
Let’s break down what these terms mean and why they matter for your campaigns.
Ad Spend is simply the amount of money a business allocates to paid advertising each month. Think of it like an advertising budget: some companies spend $500 monthly on ads, while others spend $50,000 or more.
Traffic Patterns show how many people click on those ads and when those clicks happen. This includes busy periods (like holidays) and slow periods throughout the year.
When you’re analyzing competitors in Semrush’s Advertising Research tool, you’ll see important numbers that tell you how much they’re spending and how much traffic they’re getting from their ads.
These numbers help you understand who your biggest competitors really are and how serious they are about paid advertising.
What the Numbers Tell You
So, how exactly do you identify this data in Semrush?
Traffic Cost shows you an estimate of what a competitor’s organic traffic would cost if they had to pay for it through ads.
For example, if you see a competitor has “$6.1 million” in traffic cost, that means their organic traffic would be worth about $6.1 million if they were paying for those same clicks through Google Ads.
Estimated Ad Spend gives you an idea of how much competitors are actually investing in paid advertising each month. Higher spending usually means they’re making money from their campaigns—businesses don’t keep spending money on ads that don’t work.
Traffic Volume shows you how many people are searching using this particular keyword. This helps you understand the scale of their operations and whether certain keywords or strategies are driving significant traffic.
Researching Search Ads
The Advertising Research tool is your main weapon for search advertising data. Here’s how to find and use it:
- Navigate to the tool: Find and click the ‘Advertising’ button in your Semrushmenu. Find and choose ‘Advertising Research’ from the dropdown menu
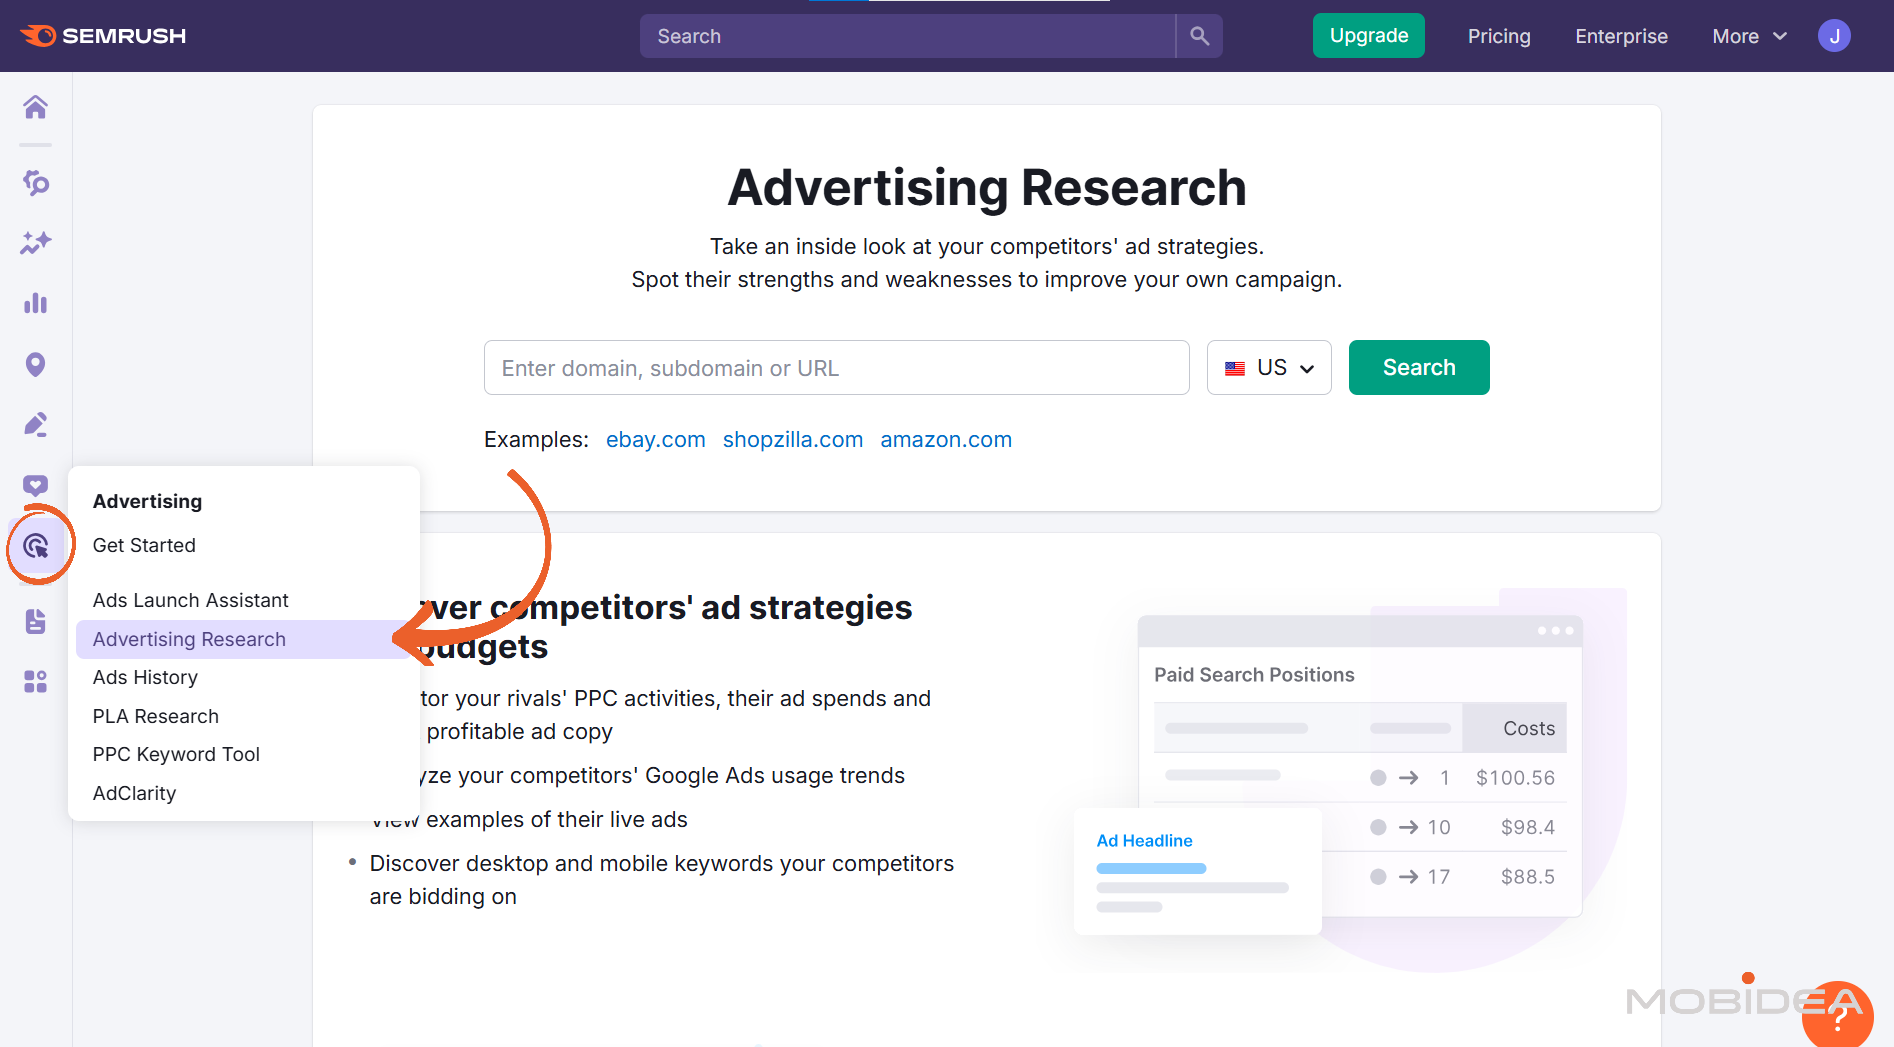
- Enter your target: Type in your competitor’s website address
- Generate insights: Click the ‘Search’ button to create detailed data
- Review the overview: Take a look at and evaluate the available data
Once you enter a competitor’s website, you’ll immediately see their advertising overview.
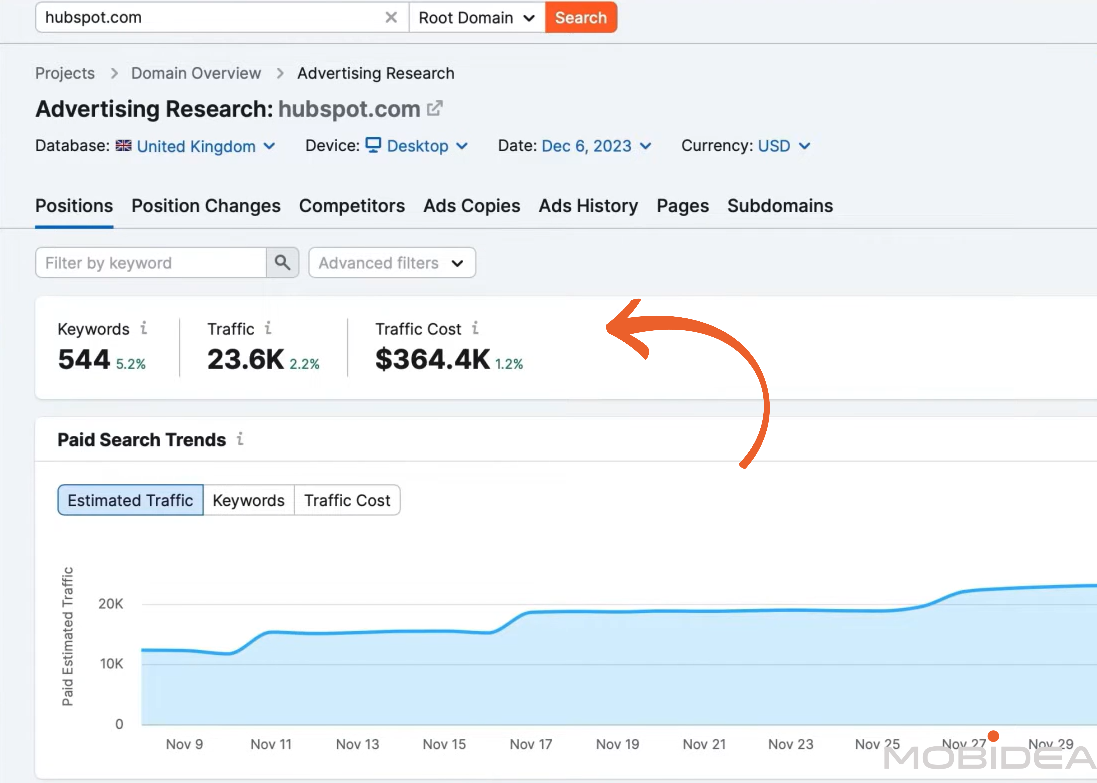
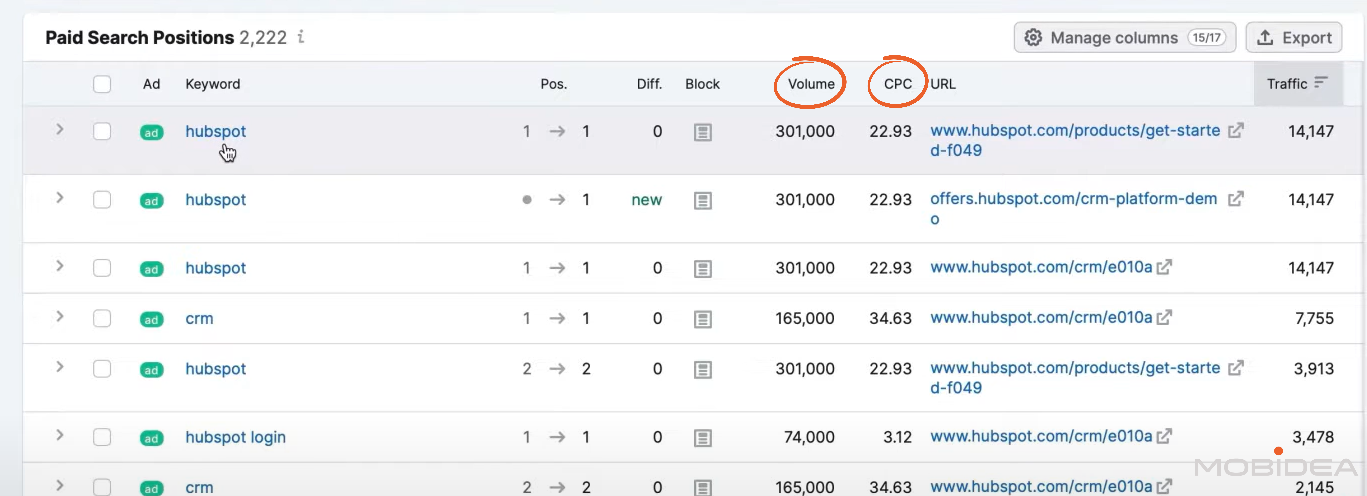
Main Dashboard View
- Traffic cost estimates appear at the top of the report
- Paid keywords count shows how many different terms they’re bidding on
- Traffic estimates show their overall paid search performance
- Individual keyword data appears in the table below with specific costs and volumes
Ad Copy Intelligence and Creative Analysis
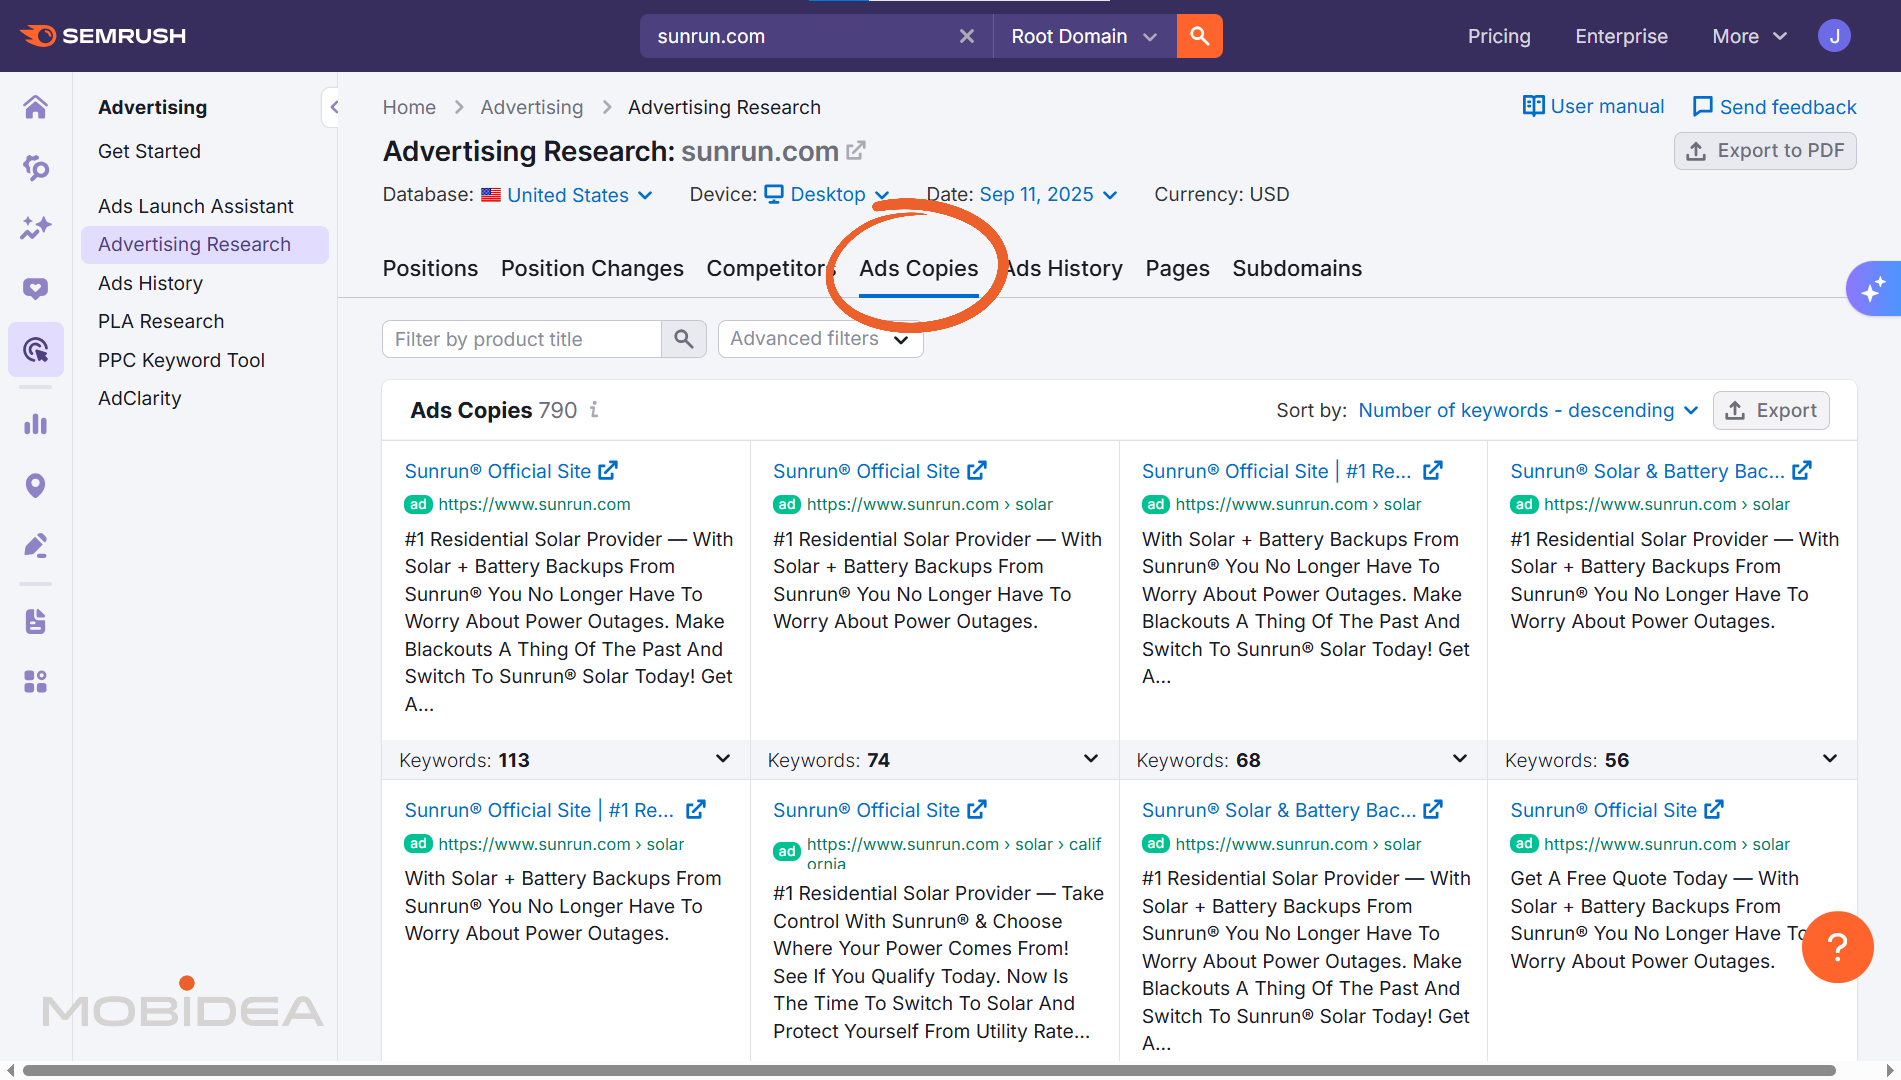
So now you have the keywords and competitor spending info, it’s time to think about how to actually capture the user’s attention, and that’s through ad creatives or ad copy.
To find them, click on the Ads Copies tab.
The dashboard now shows messaging strategies that work with your shared audience. It displays the actual advertisement competitors use, showing:
- Headlines
- Descriptions
- Calls-to-action
Landing Pages Data
Landing page analysis provides additional strategic insights. The destination URLs show whether competitors use dedicated landing pages or product pages.
This indicates their conversion optimization approach and campaign structure. To find this, simply click on the Pages tab.
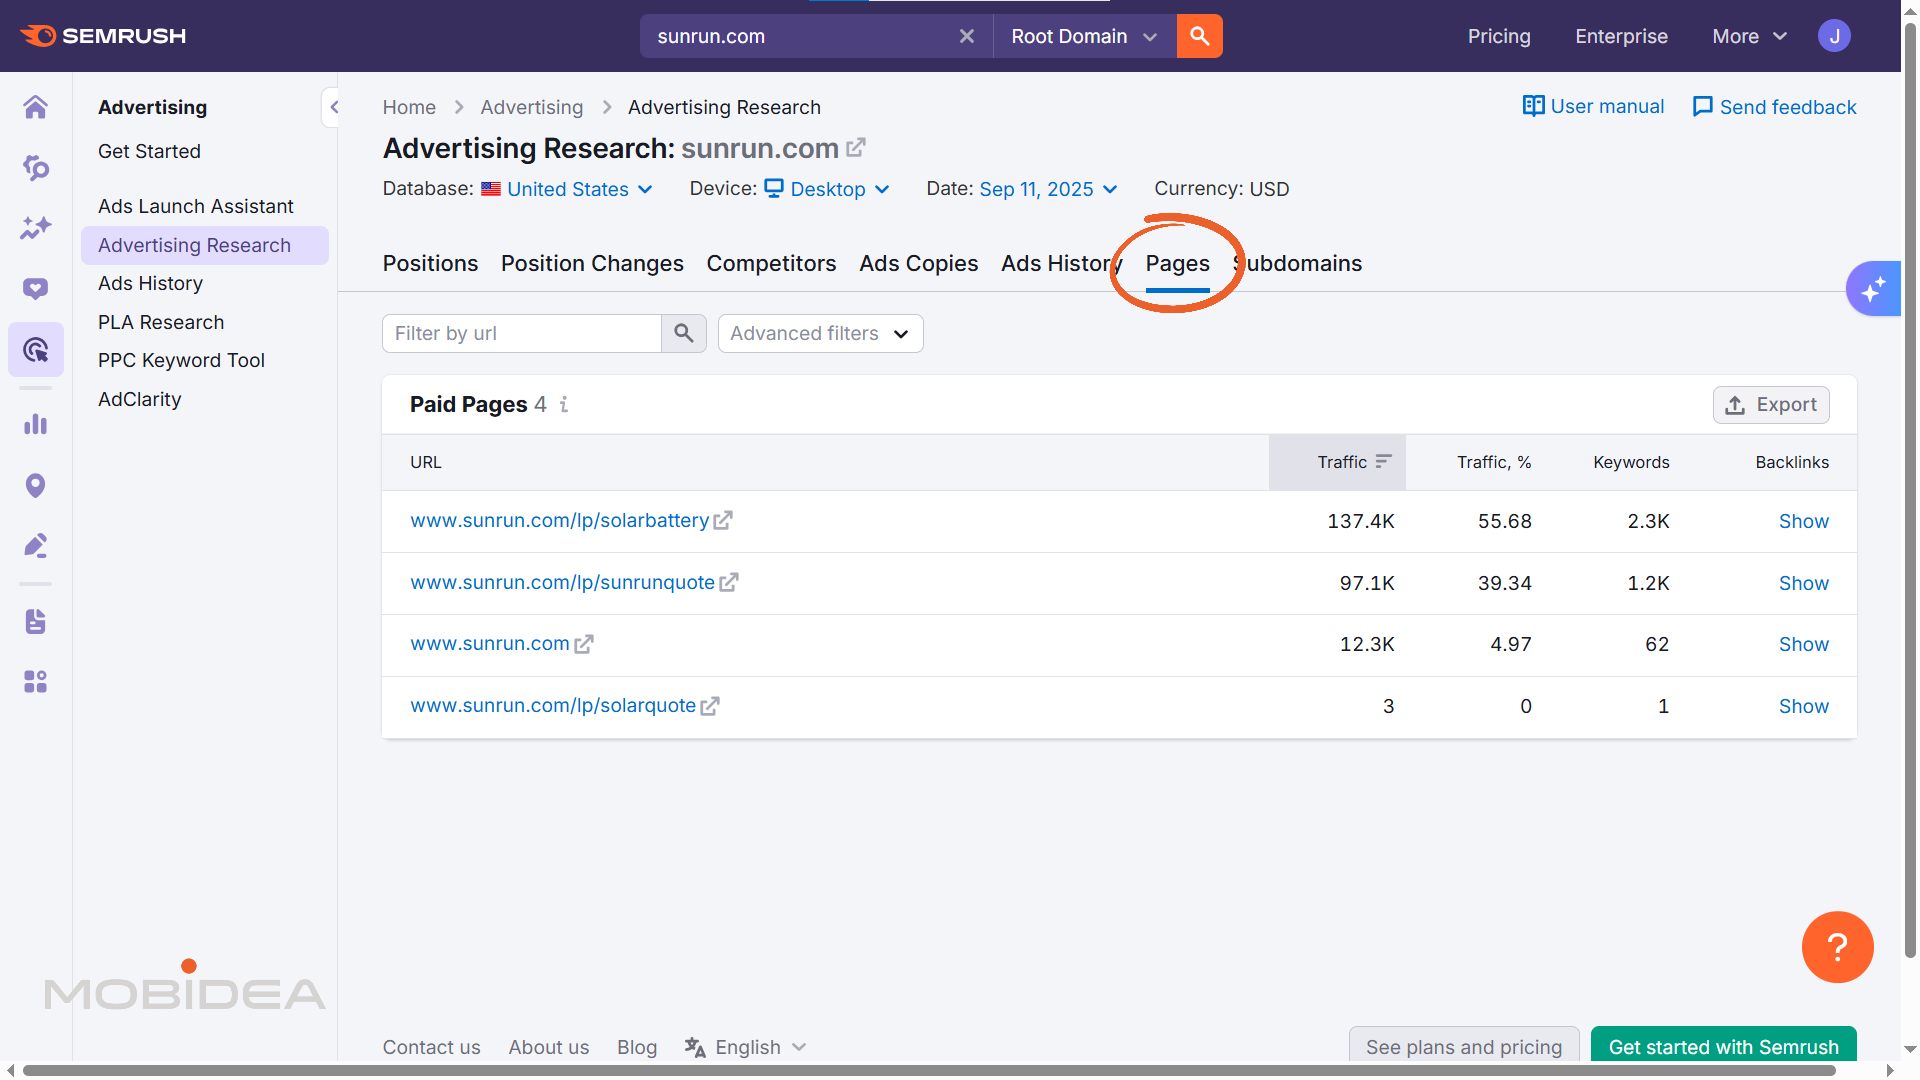
Some ad copies are matched to specific landing pages. You need to check how each one is paired to each other.
If a landing page is commonly used among ad copies, then that means that page converts well for your competitor. I suggest saving a copy of the high-performing landing page for yourself and analyzing it.
This landing page information shows you messaging approaches that already work in your market.
However, always adapt insights to reflect your unique value proposition rather than copying competitor messaging directly.
Researching Keywords
The PPC Keyword tool shows which search terms trigger competitor ads, though you can also find keyword info within the Advertising Research info.
Researching keywords gives you a foundation for expanding your own keyword targeting and understanding market dynamics.
What is each metric for?
- Difficulty scores help you assess competition levels
- Volume estimates show potential reach for each term (traffic volume, as we already explained above)
- Cost-per-click data provides info on bids. However, the amount listed here should be treated as estimates rather than exact costs.
- Traffic percentage distribution shows which keywords drive the most value for competitors.
High-traffic-percentage keywords typically represent core business terms that generate strong return on investment (ROI). This can form the foundation of your own campaigns, as base keywords.
- Position analysis shows bidding aggressiveness. Consistent top positions for high-volume keywords tells you that your competitor is serious in gaining traffic from this specific keyword.
This suggests these terms deliver strong performance for them. Use this info to prioritize keywords that deserve premium bidding.
How to Apply This Data
Start by targeting keywords with high volume but lower difficulty scores. These give you the best chance to compete without spending too much money.
Focus your biggest budget on keywords where competitors consistently bid for top positions, as this shows these terms make money for businesses like yours.
Look for keywords with medium volume and difficulty that your competitors might be ignoring—these can be great opportunities to get traffic at lower costs.
Use the traffic percentage data to build your keyword list. We suggest starting with the highest-performing terms as your foundation and then expanding to related keywords that show promise.
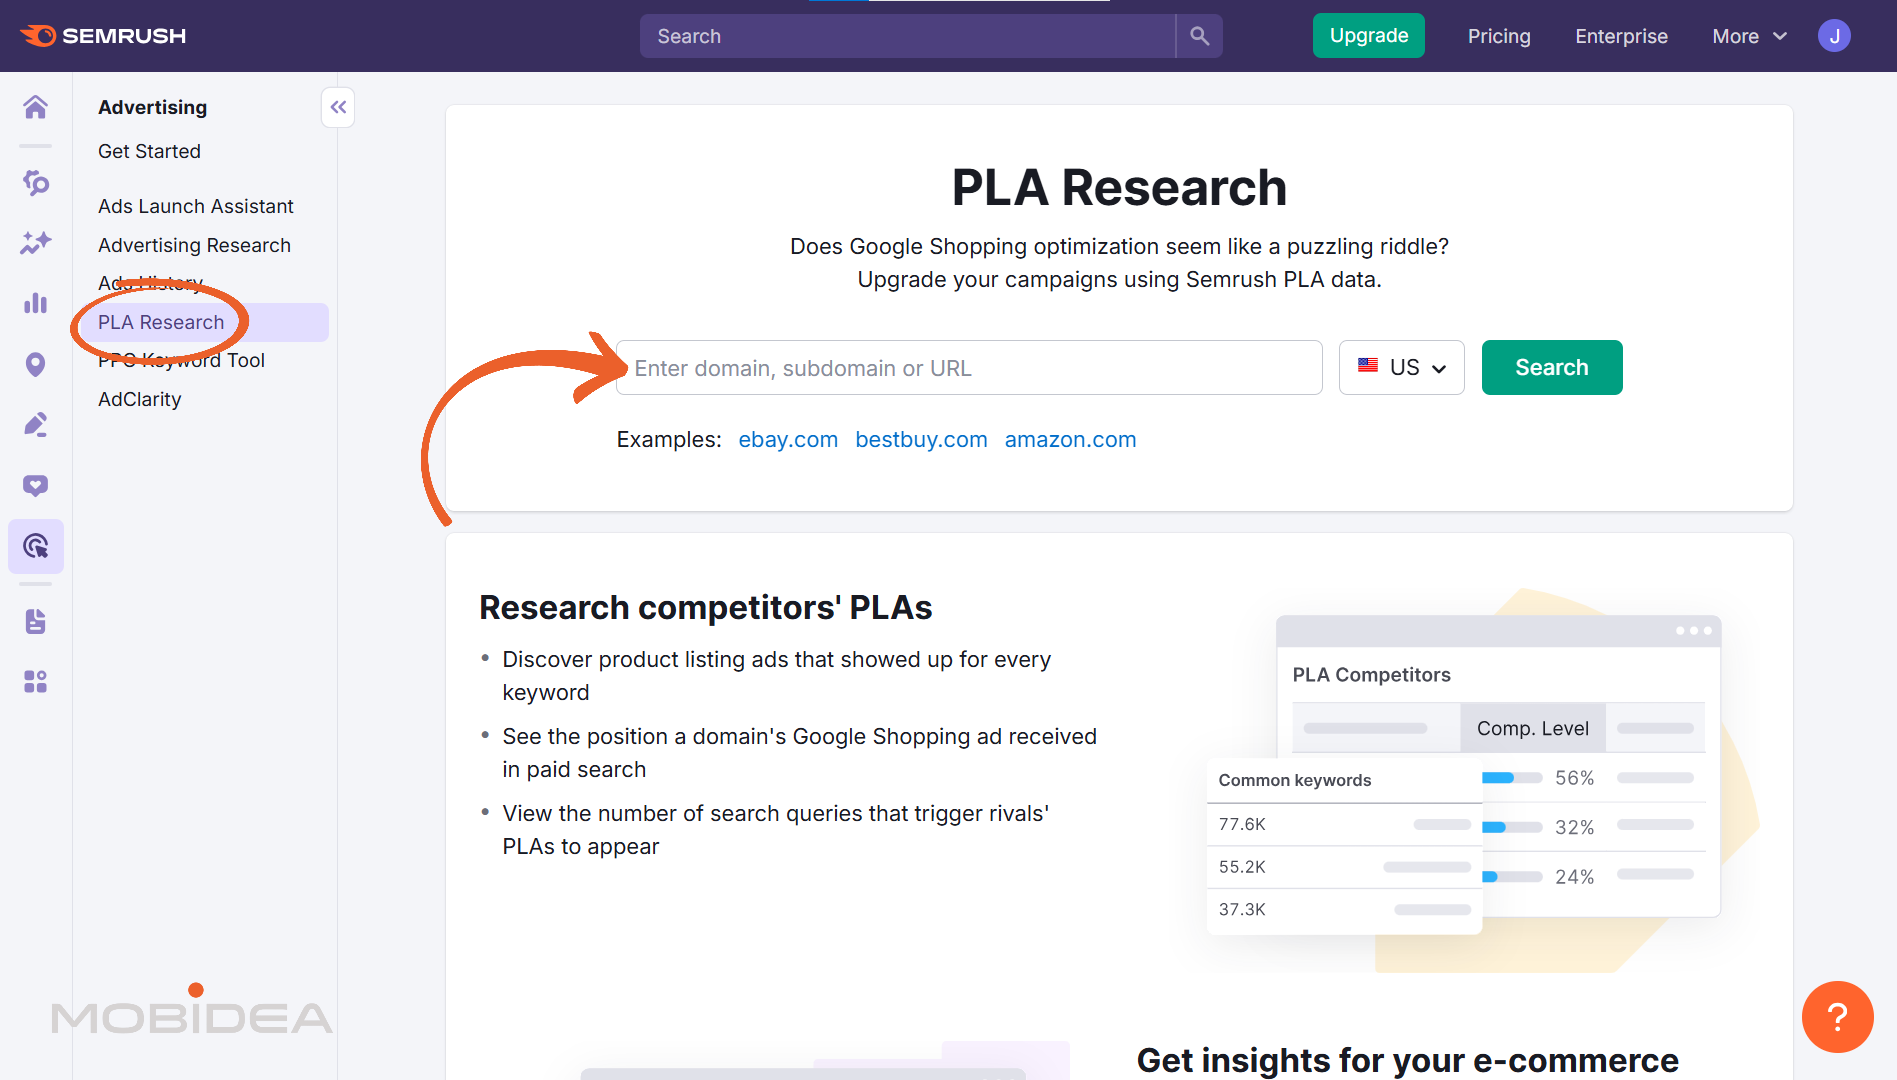
Researching Google Shopping Ads
Semrush is one of the only tools that supports Google Shopping Ads research. If your competitors sell physical products, the PLA research can provide valuable insights.
Note: PLA simply means Product Listing Ads.
From the Advertising Toolkit, select “PLA Research” and enter your competitor’s domain. The tool analyzes both keywords and actual Shopping ads, though the reports on their Pro plan are limited to the first 10 lines.
Even with limited data, you can still gather useful insights.
First, you’ll see if a competitor is actively using Google Shopping ads and how their activity has changed over time.
If they’ve increased their Shopping activity recently, this indicates the channel is profitable for your market. Consider allocating more budget here.
Second, the keyword report reveals the top search terms that trigger their Shopping ads.
Use these keywords as a starting point for your own product titles and Shopping campaigns.
Third, understand their product promotion strategy by examining their landing pages.
Look at how they structure product descriptions, pricing, and images, then test similar approaches with your own products.
While the data is limited, it’s often enough to understand a competitor’s overall Shopping strategy and identify opportunities in your own campaigns.
Why This Matters for Your Campaigns
There are several reasons why this data can be beneficial to you, such as:
- Budget Planning
If you see competitors consistently spending $10,000+ monthly, you know you’re in a competitive market that requires serious investment.
If most competitors spend under $1,000 monthly, you might be able to compete with a smaller budget.
- Timing Strategy
Watch how competitor spending changes throughout the year and during different times of the week or day. If they increase spending during certain months, those are probably high-value periods for your industry.
You can plan to either compete directly or find opportunities when they reduce spending. Pay attention to when they run their ads most heavily. This shows you the best times to reach your shared customers.
- Keyword Priorities
Keywords where competitors spend the most money are usually the most valuable.
If multiple competitors are paying high costs for certain terms, those keywords likely drive real business results.
On the other hand, you can also look for gaps where competitors have reduced their advertising activity. These might represent opportunities for you to capture market share at lower costs.
- Market Validation
Competitors who maintain consistent advertising presence over months have probably found profitable campaigns. Their persistence validates that paid advertising works in your market.
Start by identifying which competitors represent real threats versus those just testing the waters.
Persistent advertisers with higher spending levels deserve more attention in your analysis.
Remember, these numbers are estimates, not exact figures. Use them to understand trends and competitive strength rather than making precise budget decisions.
- Keywords-Ad Copy-Landing Pages Best Combinations
Look at which ad messages work best with specific keywords by studying competitor patterns.
When competitors use the same headlines or descriptions with valuable keywords over and over, it shows this messaging works well with your target audience.
This helps you create better campaigns by matching your ad text to what people are actually searching for.
- Shopping Ads Intelligence
Google Shopping ads show you how competitors present their products and set their prices in search results.
Once you see which products they promote most and how they write their product titles, you can find gaps in their strategy or ways to make your own products stand out better.
Mastering Display Advertising through AdClarity
While search advertising captures active intent, display advertising builds awareness and retargets potential customers across the web. So when it comes to understanding your competitors’ display ads strategies, Semrush’s AdClarity tool is your secret weapon.
This tool gives you a complete view of your competitors’ display strategies across banner ads, video content, and social media campaigns.
It tracks real-time advertising across 650,000 publishers in 51 global markets, showing you where competitors spend their display budgets, what creative approaches work best, and which publishers give them the most visibility.
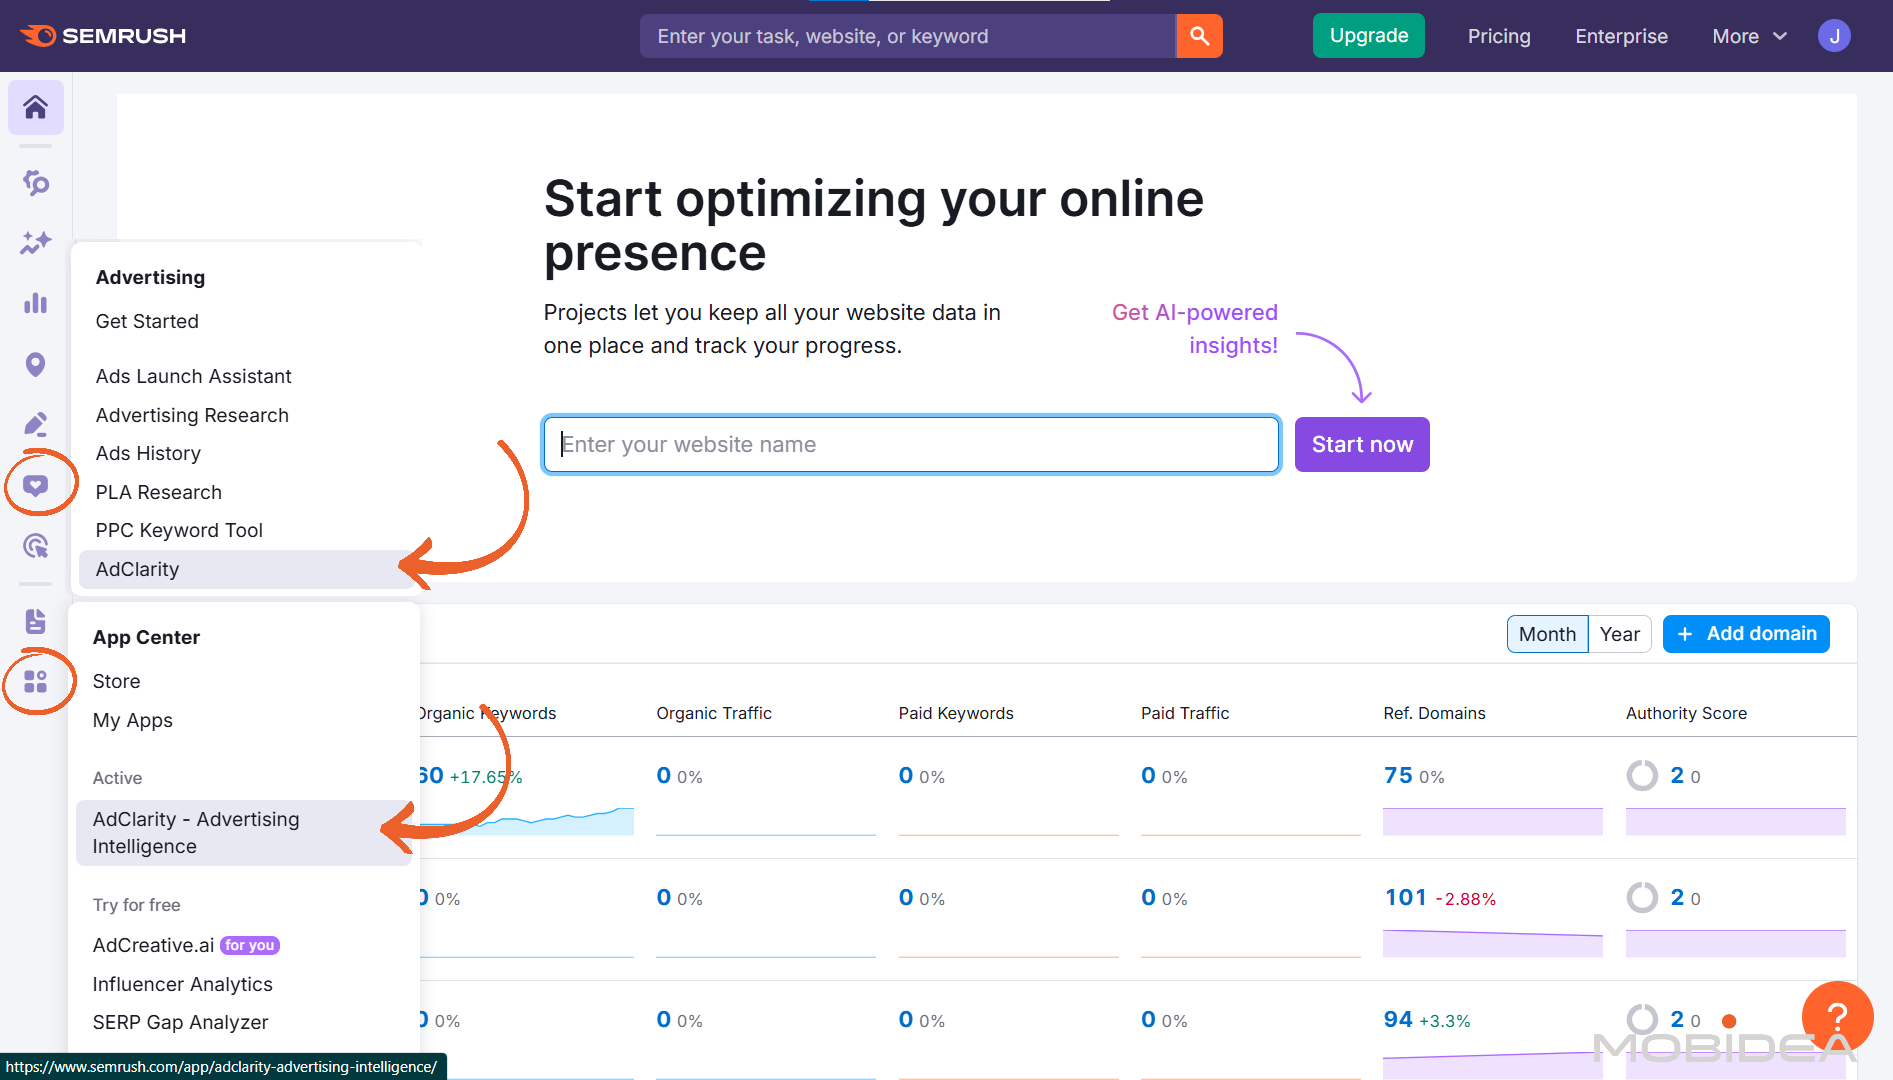
Getting Started with AdClarity
You can access AdClarity in three ways:
- from your main Semrush dashboard by typing it in search bar
- visiting the Advertising menu
- visiting the App Center
AdClarity Pricing Options
Before we proceed, it’s important to note that AdClarity requires a separate subscription from the main Semrush tools.
You can try it out with a 7-day free trial, but beyond that, you need to pay for a package.
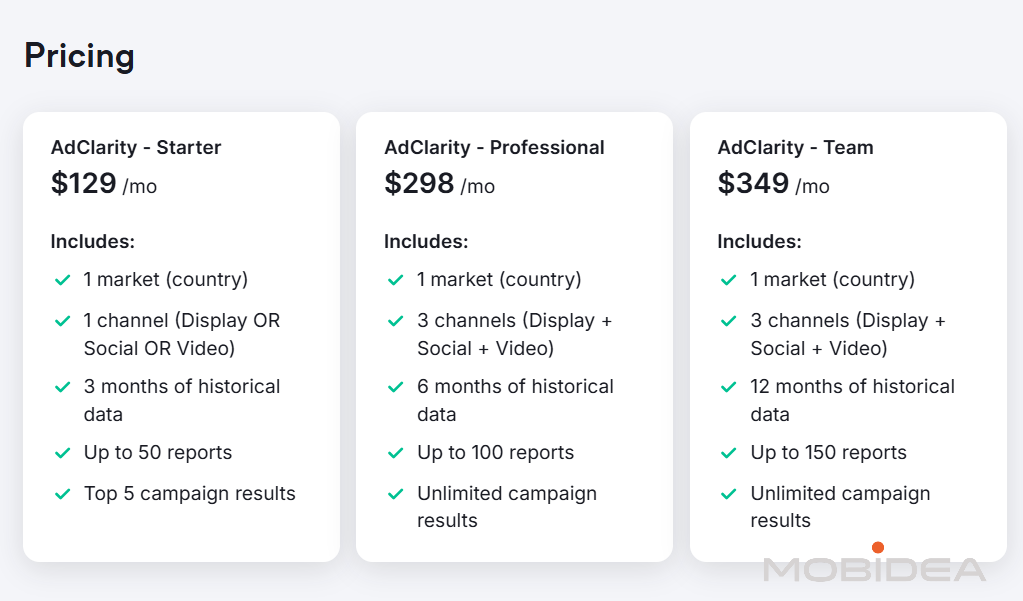
AdClarity Starter ($129/month)
This basic package lets you analyze competitors in one country, focusing on either display ads, social media ads, or video ads (you choose one). You get 3 months of history, up to 50 reports monthly, and can see the top 5 campaigns for each competitor.
AdClarity Professional ($298/month)
This package covers all three ad types (display, social, and video) in one country with 6 months of history. You get up to 100 reports monthly and can see unlimited campaign results instead of just the top 5.
AdClarity Team ($349/month)
This complete package includes all ad types in one country with a full 12 months of history and up to 150 reports monthly. The extra cost gets you 6 more months of data and 50 more reports compared to Professional, helping you spot long-term trends.
Selecting Reports
The search bar at the top lets you research either advertisers (to see where they place ads) or publishers (to see which brands advertise on their sites). Choose your geographical market from the dropdown menu, as this affects all data you’ll see.
There are different reports to choose from: Advertisers, Publishers, Campaigns and Keywords.
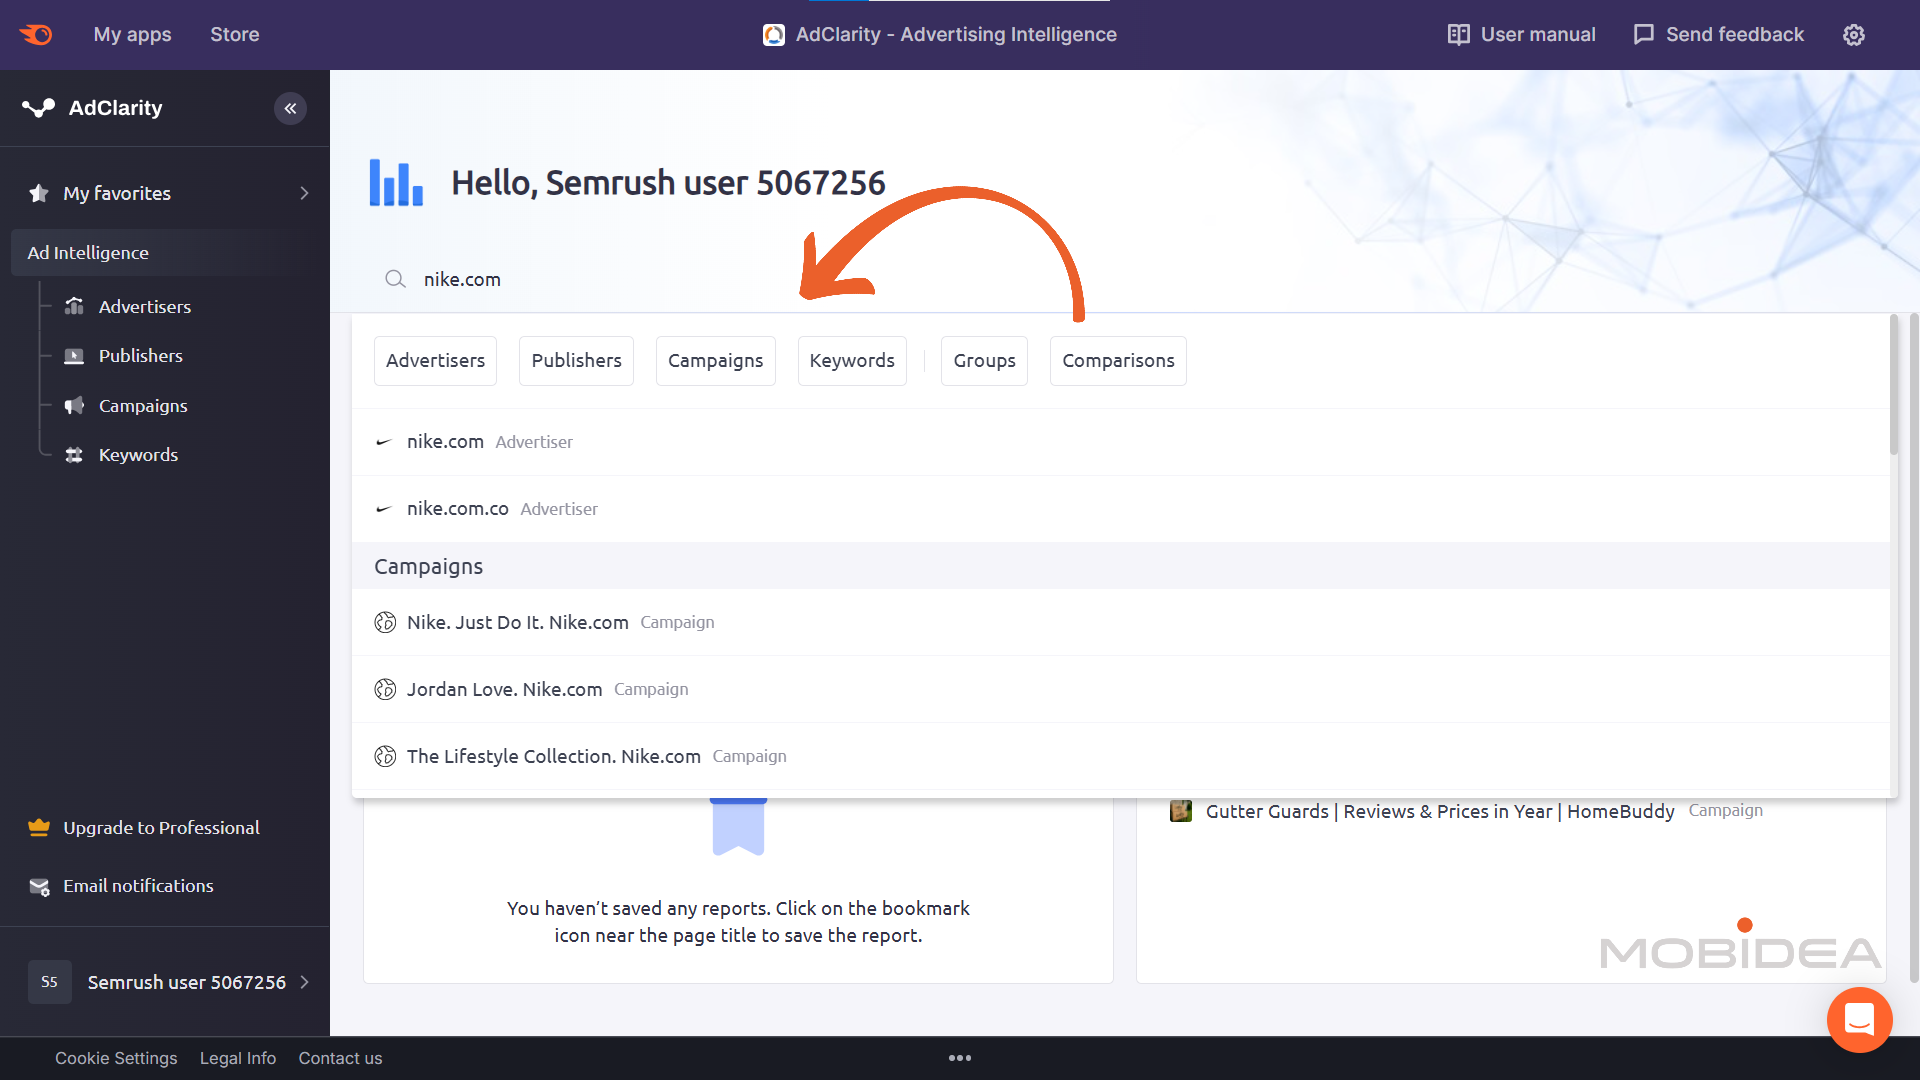
Advertiser Reports show you all the places where a specific company runs display ads. Enter “nike.com” and you’ll see Nike’s complete media buying strategy and discover new publishers for your own campaigns.
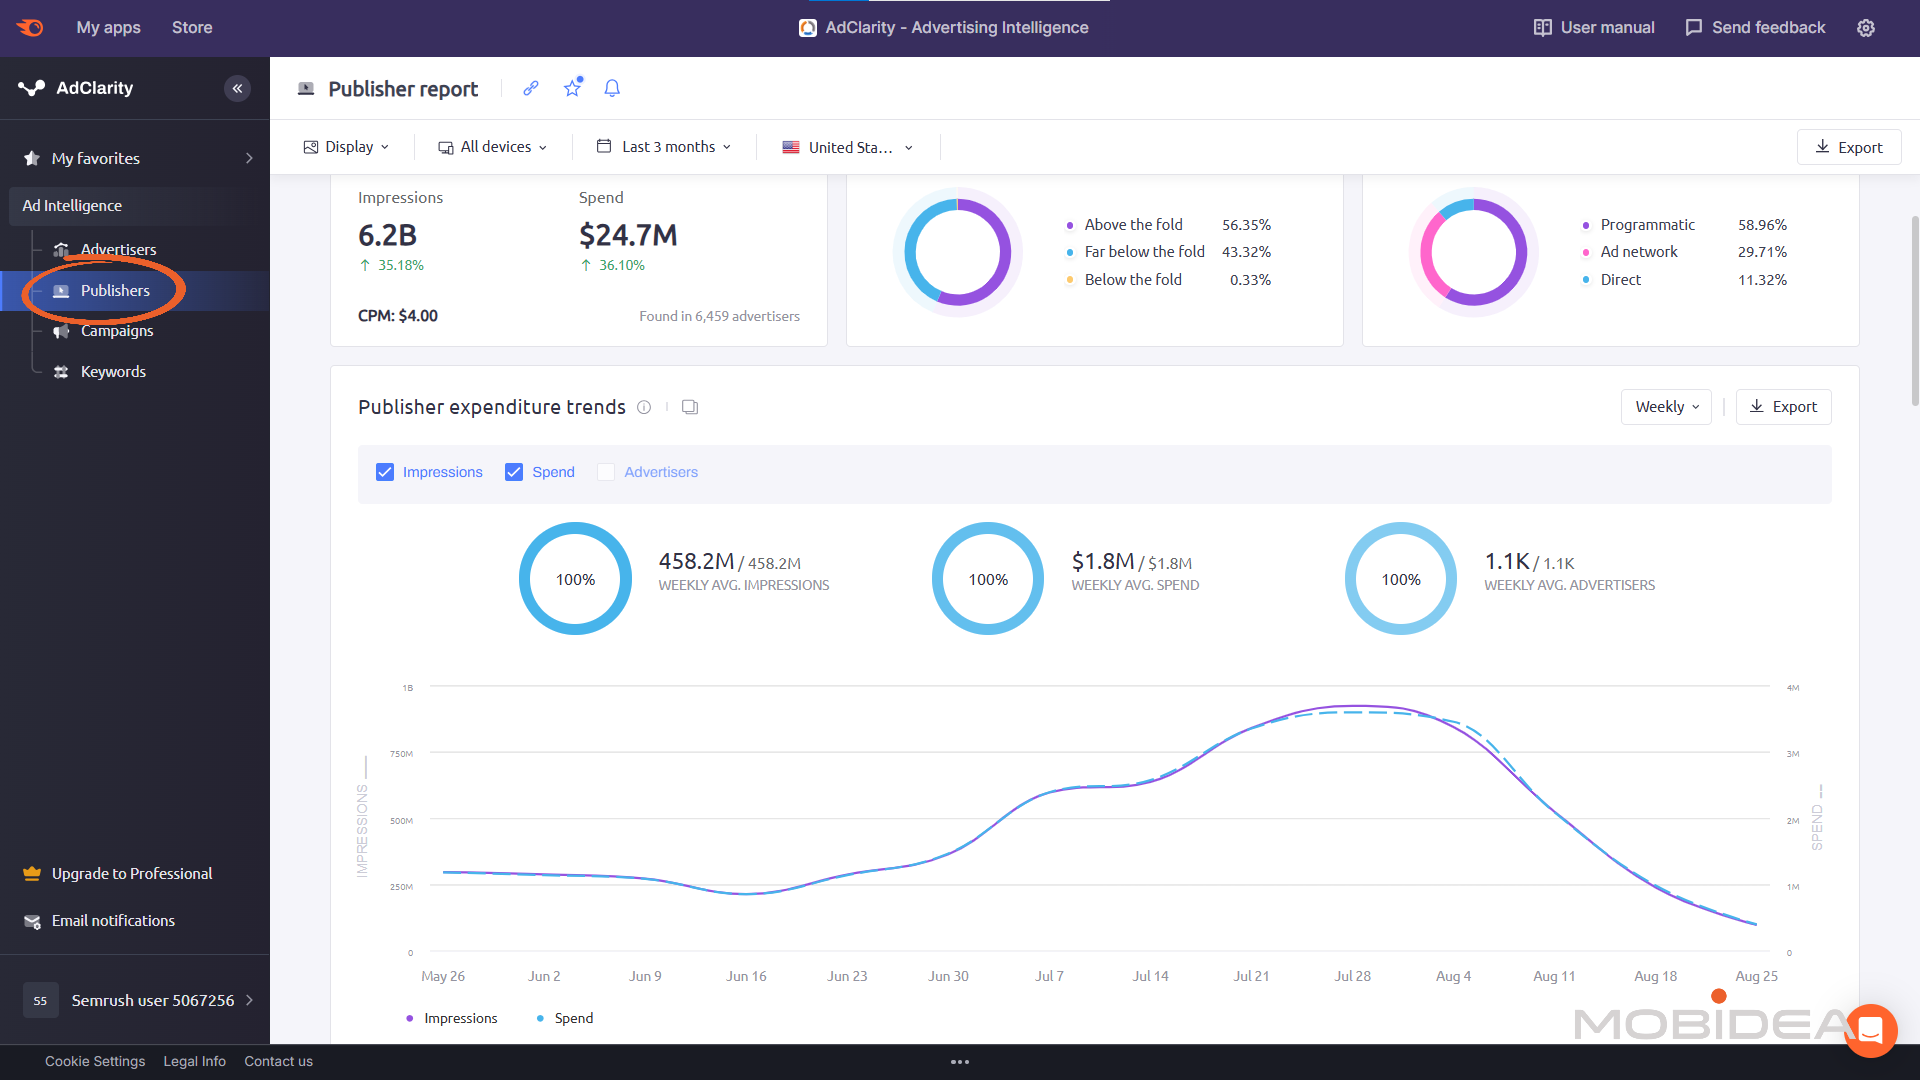
Publisher Reports reveal all the brands advertising on a specific website. Search “cnn.com” to see CNN’s advertiser roster and identify new advertising opportunities or competitive threats.
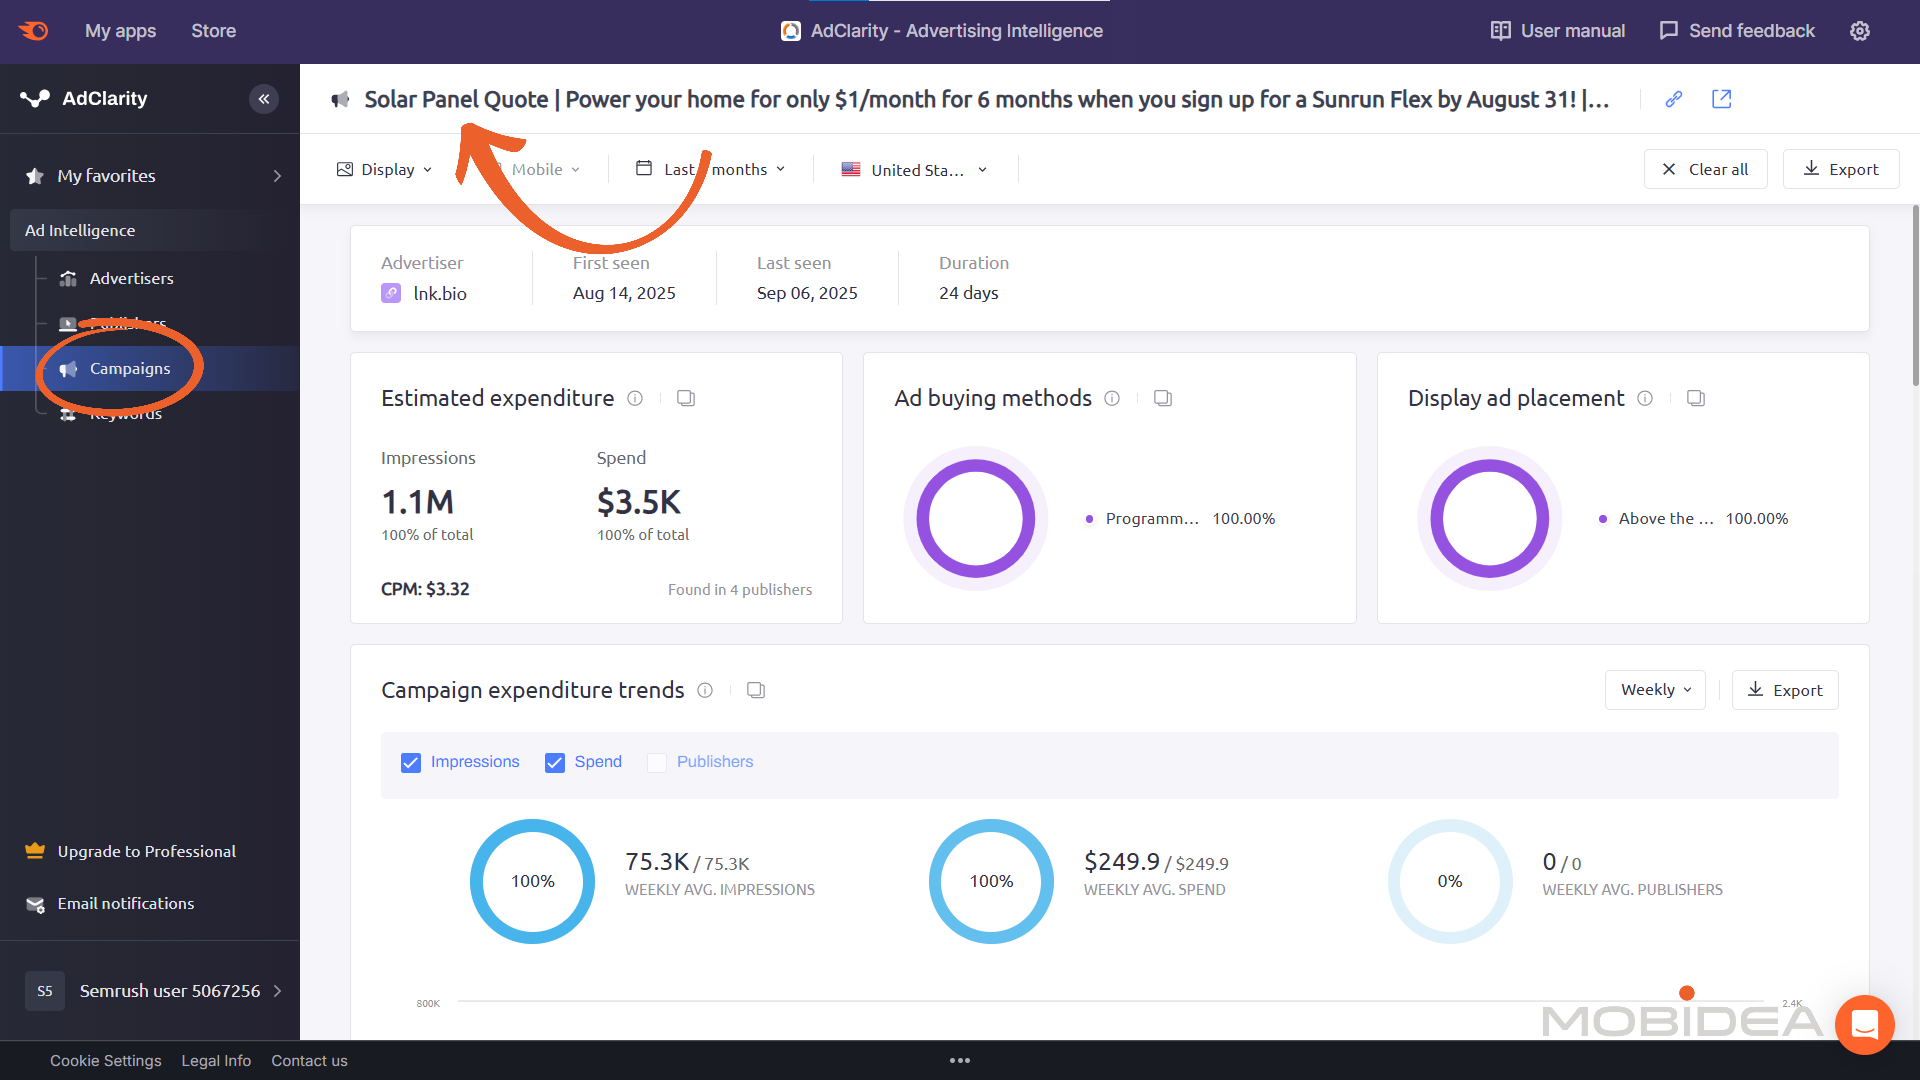
Campaign Reports analyze the performance of specific advertising campaigns.
A campaign is essentially a group of coordinated ads that all lead to the same landing page. These reports are valuable because they show you:
- Which advertiser is running the campaign
- Campaign duration (first seen and last seen dates)
- Performance metrics like impressions and spend
- The actual creative assets used in successful campaigns
Campaign reports help you understand how competitors structure their advertising efforts and identify their most successful promotional strategies.
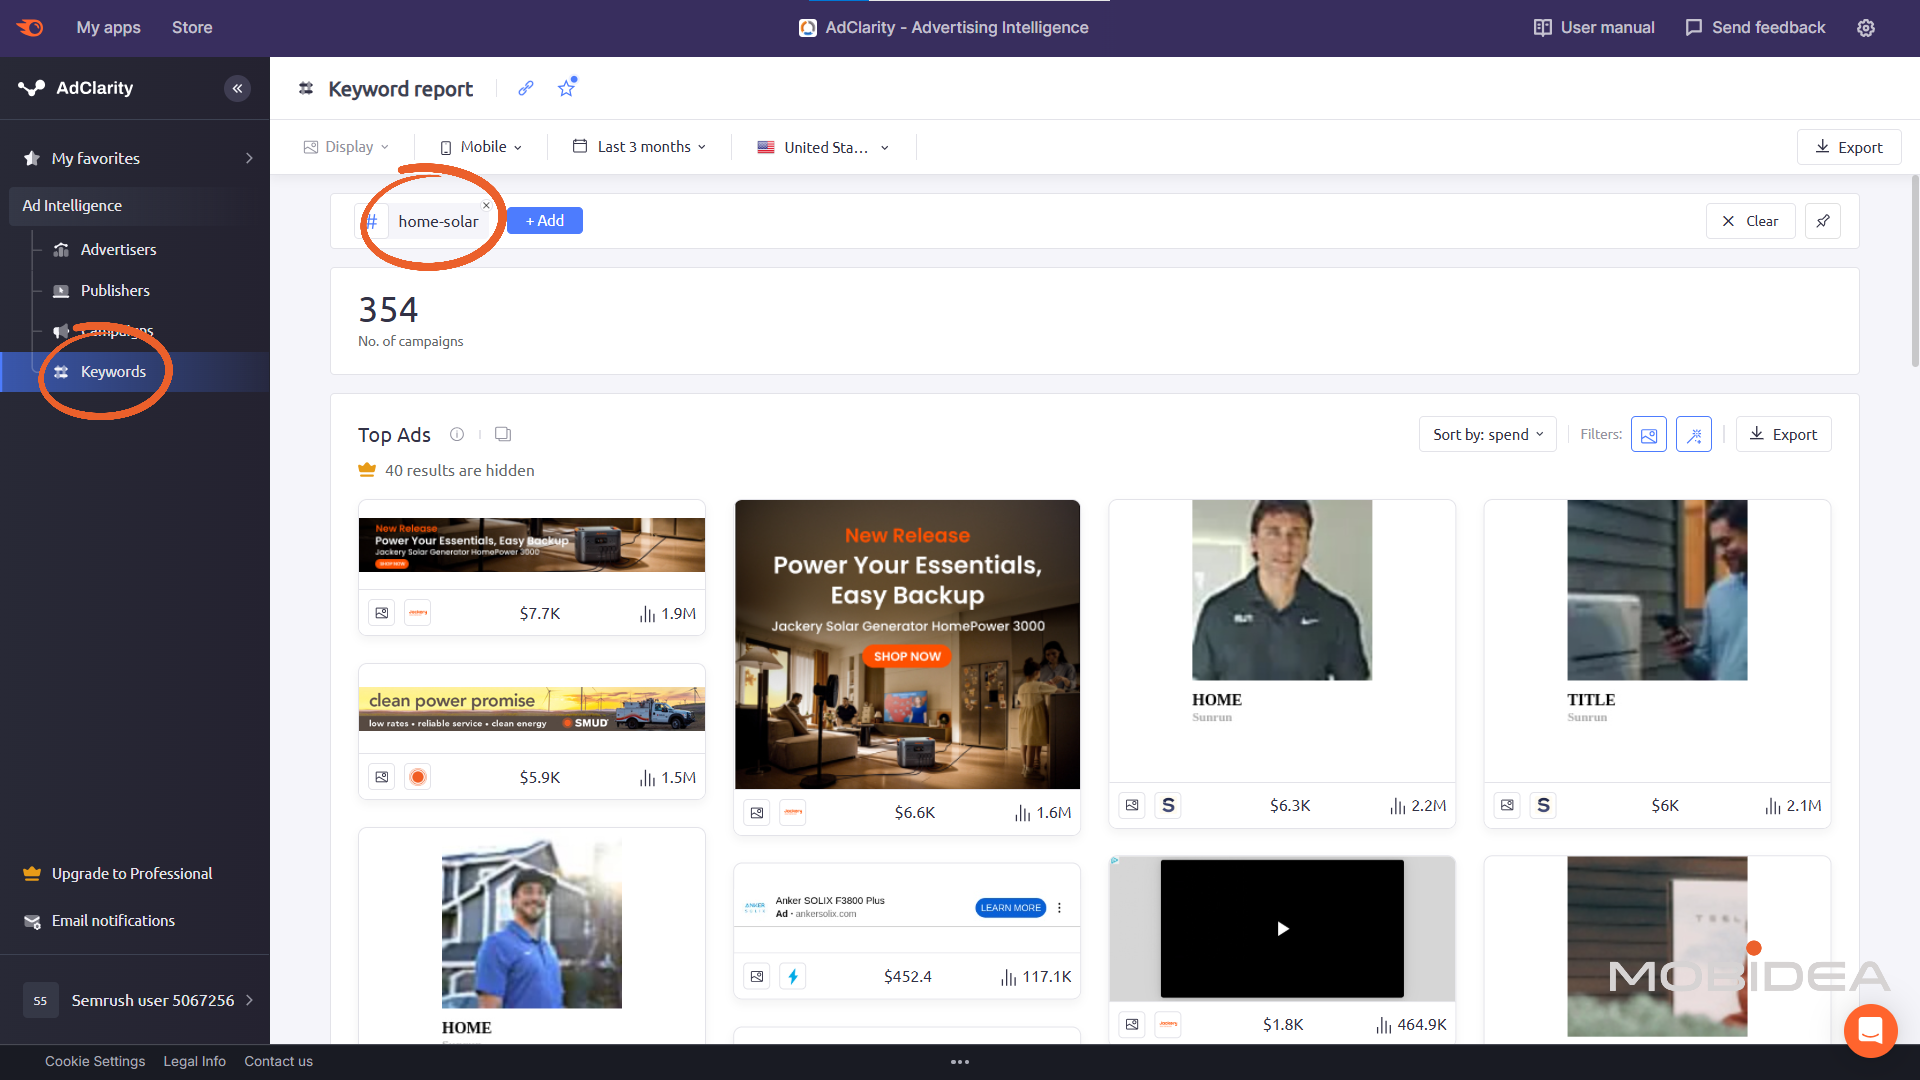
Keywords Reports analyze campaigns based on specific search terms that trigger ads. This report type is particularly useful for understanding:
- How many campaigns are targeting specific keywords
- Which search terms drive the most advertising activity in your industry
- Top-performing ads associated with valuable keywords
- Competitive density around important search terms
To get a report, type your keyword, separated by dashes if they’re part of one keyword phrase.

Keywords reports bridge the gap between search advertising intelligence and display advertising, showing you which terms are valuable enough that competitors run display campaigns around them.
Analyzing Ad Spend and Performance Data
AdClarity provides estimated spending and impression data that helps you understand competitive investment levels.
While not 100% precise (platforms like Facebook don’t publicly share exact spending), these figures offer valuable benchmarks for your planning.
The Top Campaigns report shows competitor spending per campaign, along with impression counts and estimated CPM data (cost per thousand impressions).
The Social Networks report breaks down ad spend across Facebook, Instagram, LinkedIn, and Twitter, revealing which platforms competitors prioritize. We’ll talk more about this in latter sections.
Use this data for trends and relative comparisons rather than exact budget planning.
Creative Analysis and Placement Intelligence
This feature lets you see the actual ads your competitors are running, giving you direct insight into what messages and visuals work in your market.
Finding Competitor Ads
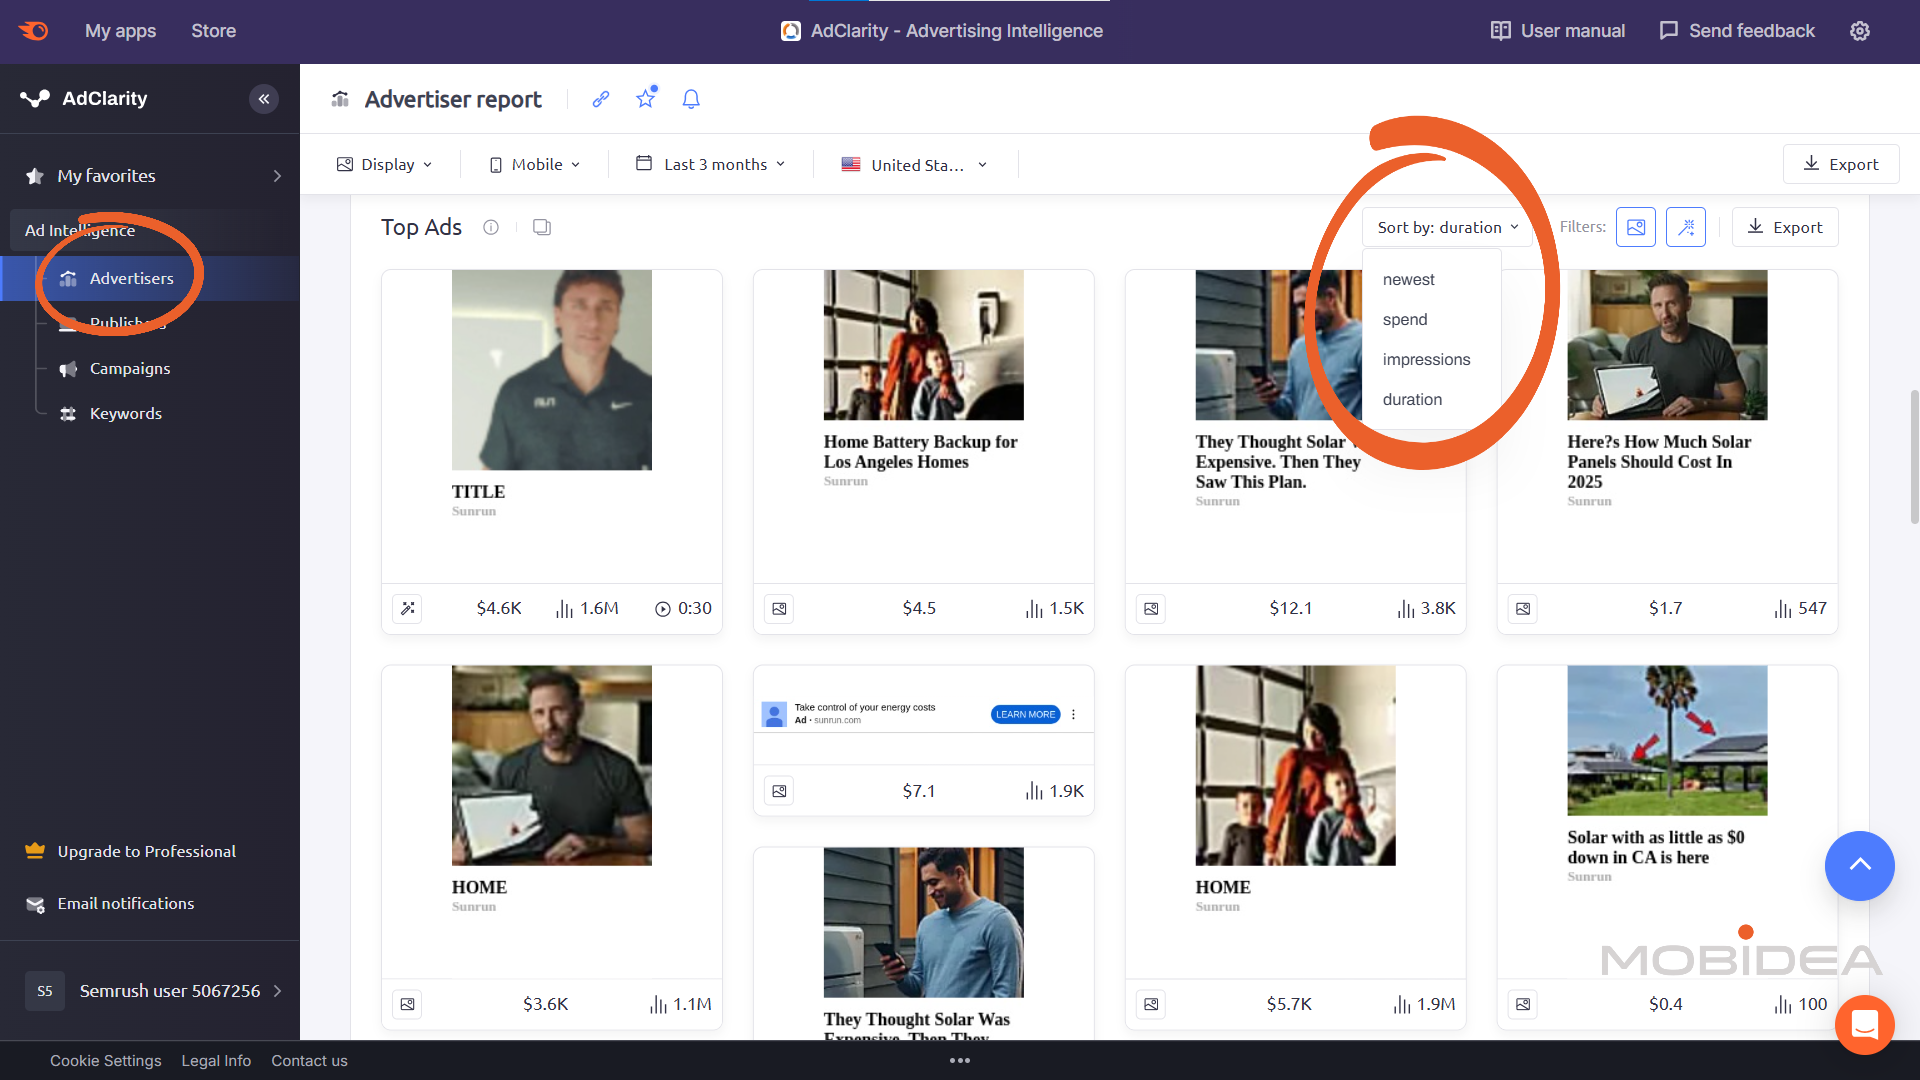
Navigate to the “Top Ads” section of the Advertiser Report and use these filters to focus your analysis:
- Ad Spend & Impressions: Find high-budget, high-reach campaigns
- Ad Duration: Identify successful long-running ads (longevity usually indicates success)
- Newest Ads: Spot emerging trends and fresh creative approaches
- Ad Type: Filter by social images, videos, and other formats
- Devices: Desktop and/or mobile devices
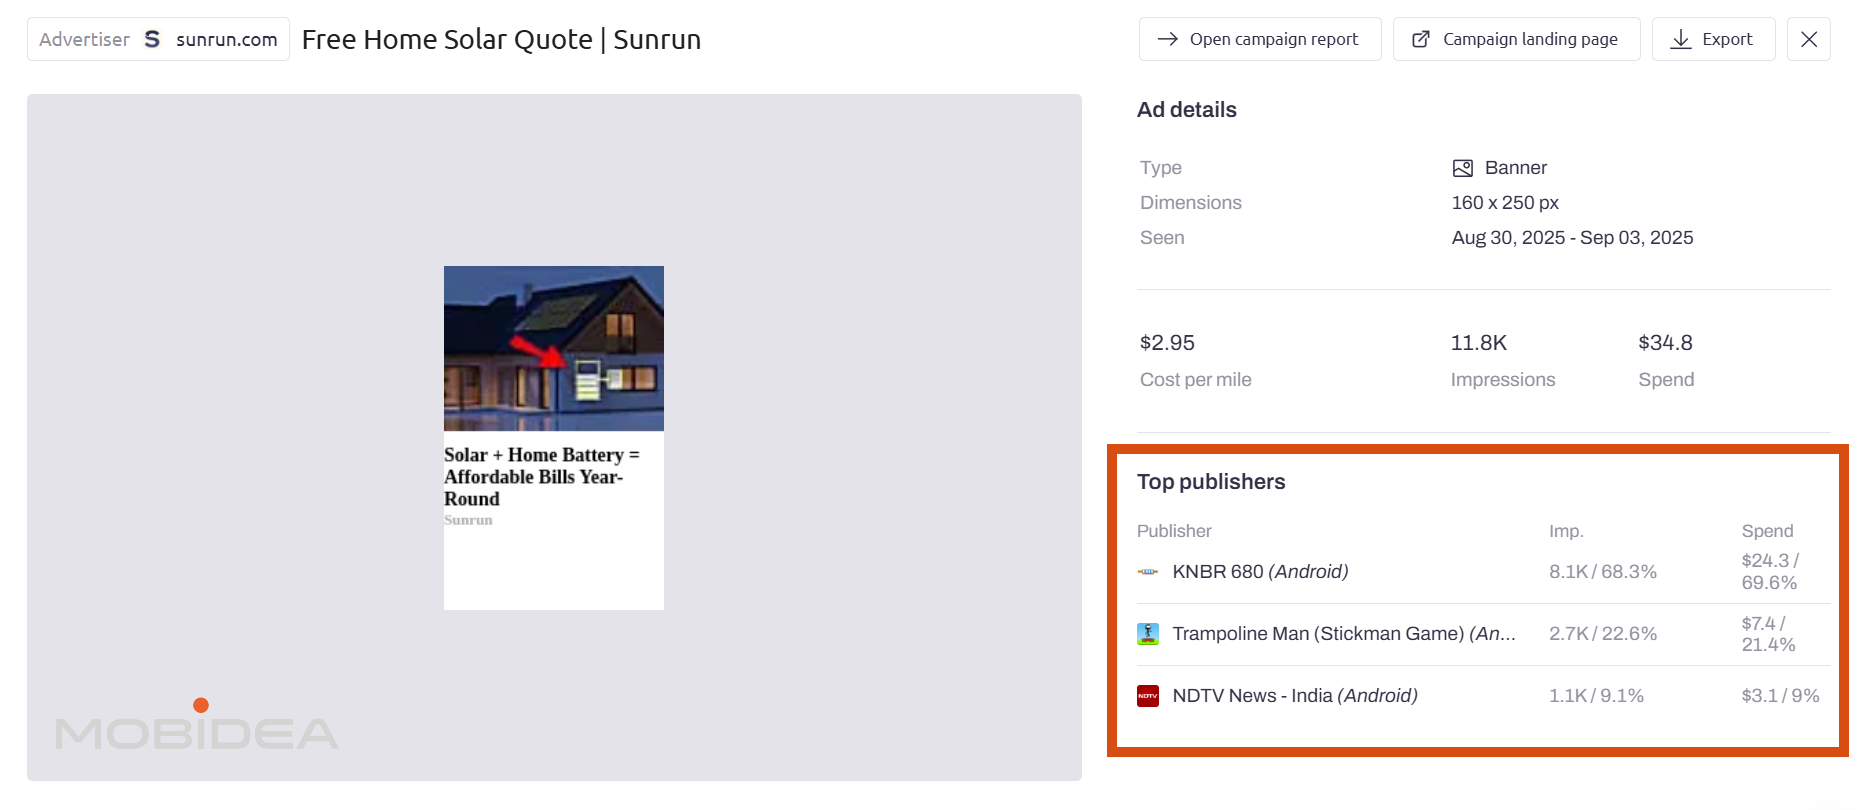
Placement Intelligence
AdClarity shows you which websites and apps competitors choose for their ads. This placement data is extremely valuable because it reveals:
- High-performing websites where your ads might also succeed
- Placements competitors have stopped using (possibly because they don’t work well)
- Popular websites in your industry that you might not have considered
What to Look For in Placements
If competitors consistently advertise on specific websites, those placements likely convert well for your type of business.
If you see competitors have reduced their ads on certain websites, it might mean those placements don’t work well—helping you avoid wasting money.
Visual Analysis for Better Ads
Look closely at the design elements that work. Pay attention to color schemes, button styles, and overall design looks that appear in successful ads.
Notice which call-to-action buttons (like “Buy Now” or “Learn More”) competitors use most often.
When you see the same design approaches across multiple successful campaigns, these elements likely work well with your target customers.
This saves you time in testing because you can start with approaches that already prove successful in your market.
Applying Creative Insights
Don’t copy competitor ads exactly. Instead, identify successful patterns and adapt them to your own brand.
If competitors consistently apply the principle of urgency in their wording, like “Limited Time” in their headlines, test similar approaches but with your own unique message.
Video Advertising Intelligence
Video advertising represents a growing opportunity, and understanding competitor video strategies helps you find untapped channels for your campaigns.
YouTube Channel Analysis
Access the Video channel option in AdClarity’s main navigation. The YouTube Channels widget shows you exactly where competitors run video ads on YouTube.
Key Metrics You’ll See:
- Number of active campaigns per channel
- Impression counts and share of total video impressions
- Estimated ad spend distribution
- Share of Voice (how visible your competitor is compared to other advertisers in the same space)
Click “View all” at the bottom of the widget to see the complete report with detailed placement data.
Understanding Video Performance
The video ads section shows actual competitor video ads with length and performance information.
This helps you understand whether competitors focus on short videos (15-30 seconds) or longer content, and which approach gets better results.
Competitive Visibility Analysis
The competitive visibility data shows you how intense the competition is on different video channels.
This is important because it helps you find opportunities where there’s less competition but good performance potential.
For example, if most competitors focus heavily on one popular YouTube channel, you might find better value and less competition on similar channels that they’re ignoring.
Strategic Applications
Use this data to find high-performing YouTube channels in your industry for your own campaigns.
If competitors consistently advertise on specific channels, those placements likely work well for businesses like yours.
Look for channels where competitors have reduced their activity recently. These might offer you lower competition and better prices for your video campaigns.
Pay attention to video lengths and styles that get the most views. This guides your own video creation and helps you match successful approaches while adding your unique message.
Social Media Intelligence: Your Secret Weapon for Paid Social Success
Here’s the truth: your competitors are probably beating you on paid social media right now, and you don’t even know it.
They’re stealing your customers with better ad targeting, smarter budget allocation, and creative approaches that convert while you’re still guessing what works.
But what if you could see exactly what they’re spending on social ads?
What if you knew which creative formats get them the best results, and even which audiences they’re targeting?
That’s where social media intelligence comes in, with Semrush helping you out through its Social Toolkit.
It’s like having inside access to every competitor’s paid social strategy, showing you their playbook so you can optimize your own media buying decisions.
Getting Started with the Social Toolkit
Some advertisers make the mistake of jumping straight into paid social without understanding what’s already working in their market.
But professional media buyers know there’s huge value in seeing the organic content that drives engagement: because this shows you what resonates with your target audience before you spend money on ads.
The Social Toolkit includes five tools that work together:
- Social Poster creates and schedules content across Facebook, Instagram, LinkedIn, Twitter, Pinterest, and TikTok.
- Social Tracker monitors your competitors’ social media performance and strategies (both organic and paid) and compare it to your own
- Social Content Insights help you track the performance of your social media posts across various platforms in one unified dashboard
- Social Analytics measures your own social media performance across multiple platforms.
- Social Content AI generates content ideas using artificial intelligence.
For media buyers, the real gold is in Social Tracker as it shows you what content themes and messaging styles get the best engagement rates.
This intelligence helps you create better-performing paid social campaigns from day one.
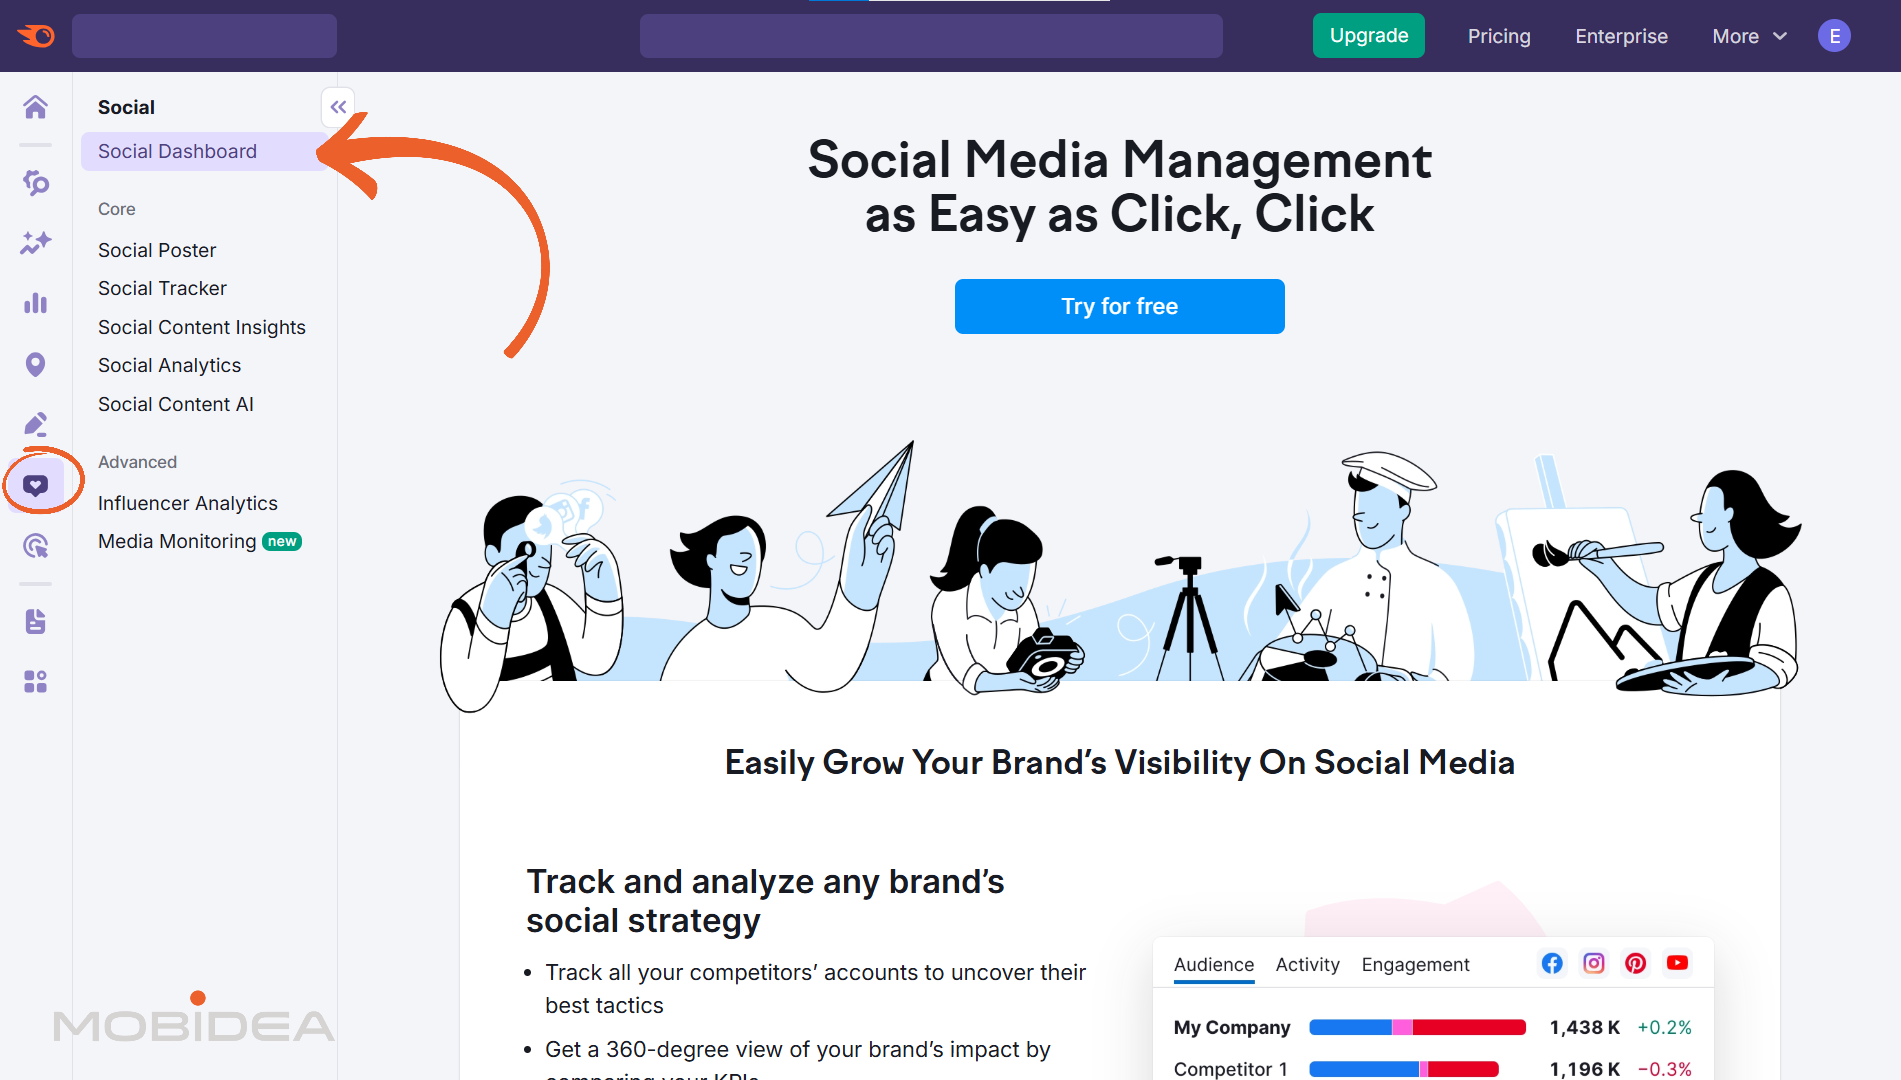
To access these tool, head to “Social dashboard” in your main Semrush dashboard, then choose any of the tools under it.
Semrush Social Pricing
Semrush’s social tools aren’t included in your regular Semrush subscription—they cost extra.
But once you see what they reveal about your competition’s paid social strategies, you’ll understand why smart media buyers consider this their secret weapon.
- Base Plan ($20/month) Has access to all 5 core tools: Social Poster, Social Tracker, Social Content Insights, Social Analytics, and Social Content AI. Limited to 50 scheduled posts per month and 30 AI-generated content pieces.
- Pro Plan ($40/month) Includes all 5 core tools with the same functionality as Base, but removes the scheduling and AI generation limits for unlimited usage.
- Business Plan ($250/month) Contains all 5 core tools plus two additional advanced tools: Influencer Analytics for discovering and analyzing influencers across YouTube, Instagram, TikTok, and Twitch, and Media Monitoring for tracking brand mentions across social media, forums, news, and other platforms.
How to Research Competitor Paid Social Strategies (The Smart Way)
Here’s the strategy: organic social performance shows you what resonates with your target audience.
When you see a competitor’s organic post getting 10,000 likes and 500 comments, that’s valuable data about what messages and visuals work with your shared customers.
Smart media buyers use this intelligence to create better-performing paid campaigns.
Go to “Social Tracker” from the Social Media Toolkit dashboard. You will be asked to connect your social profiles to Semrush.
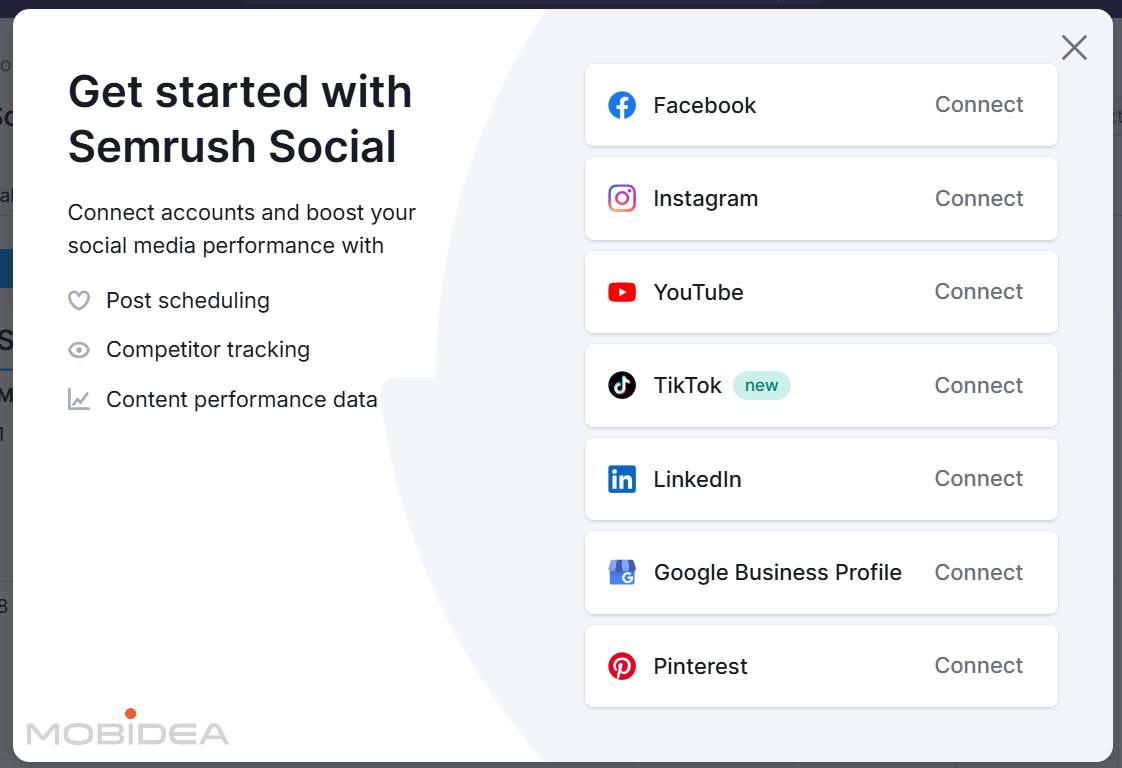
Click the “+” button or “Add Competitor” link to start tracking competitors.
Type in competitor names or handles, and Semrush will find their profiles across Facebook, Instagram, LinkedIn, Twitter, TikTok, and Pinterest automatically.
If you have their website domain name, you can use that, too.
You can track between 5 and 20 social profiles depending on your plan level. Organize them into different projects if you’re tracking competitors for different brands or markets.
![]()
The Social Tracker dashboard shows you how all your competitors are doing.
Individual platform tabs let you dig deeper into specific social networks.
The comparison view is where things get really useful for media buyers.
It shows multiple competitors side by side, so you can easily see who’s getting the best engagement rates with content that’s similar to what you want to promote in paid campaigns.
You’ll see key data for their audience, activity, and engagement compared to yours. The table also shows the change in each of these metrics and whether there is growth (with theirs and yours).
![]()
How to Turn Organic Performance Data into Paid Social Gold
Here’s what separates successful media buyers from the rest: they don’t just look at engagement numbers, they use them to predict what will work in paid campaigns.
Audience Growth Intelligence for Ad Targeting
The audience growth section shows you which competitors are gaining or losing followers over time.
Look for sudden jumps as these often mean successful campaigns or viral content that you can learn from.
![]()
If a competitor gains 10,000 followers in one week, they probably hit on messaging or content that resonates strongly with your target market.
Use this data to identify the best-performing competitors in your space, then study their content themes for your own paid social campaigns.
Engagement Rate Analysis for Creative Direction
Engagement rate comparisons help you see which competitors are best at creating content that people actually care about.
The tool also shows engagement rates as percentages (aside from actual counts), so you can fairly compare competitors with different audience sizes.
![]()
High-engagement organic posts reveal what creative styles and messaging approaches work with your shared audience.
Content Strategy Intelligence for Paid Social Campaigns
Go to the “Posts” tab within Social Tracker to see what types of content work best for competitors.
This section shows you detailed reports on social media content performance, helping you spot the content types that get the most engagement.
You can also choose the post type (photo or video) when checking out posts. Hover over the post and click on “Expand” to show the full post.
![]()
Look at content themes using hashtag and keyword tracking.
The tool shows which topics and hashtags competitors use most often and which ones get the best engagement.
This intelligence helps you choose better targeting options and ad copy themes for your paid social campaigns.
You can also see posting patterns and timing strategies. Some competitors might post multiple times daily, while others focus on fewer, high-quality posts.
Use this timing intelligence to optimize your ad scheduling and budget allocation.
Another Game-Changer: AdClarity’s Paid Social Intelligence
While Social Tracker shows you what works organically (and you can use this data to build better creative strategies), AdClarity’s Social tool is where you get the real paid social intelligence that media buyers actually need.
This is where you can see exactly what your competitors are spending on social ads, which creative formats they’re scaling, and which platforms they’re prioritizing with their media budgets.
Finding Competitor Paid Social Campaigns
Access social advertising intelligence through AdClarity Social & Video from the main AdClarity interface.
The social advertising dashboard looks similar to the display advertising dashboard but focuses specifically on social media ad placements.
Enter competitor domains in the search field just like you did for display advertising research. The tool shows you estimated ad spending and campaign data across social media platforms.
Use platform dropdown menus to filter results by specific networks. Focus on Facebook, Instagram, LinkedIn, TikTok, or view data across all platforms at once.
Analyzing Competitor Ad Creative and Spend
The social ad creative analysis works similarly to display ad analysis but focuses on social media formats and placements.
Go to the social ads section within AdClarity to view actual social ad copies and creative formats.
The tool shows you the ads your competitors are running, including images, videos, and ad copy.
Look at ad duration and performance numbers to understand which creative approaches work best.
Ads running for longer periods usually indicate better performance, since companies typically pause ads that don’t convert quickly.
What Media Buyers Should Extract from This Data:
Look for patterns in successful social ads that you can adapt for your own campaigns.
If competitors consistently use user-generated content or testimonial-style visuals, these approaches likely work well with your shared audience.
Pay attention to call-to-action language patterns such as:
- Shop Now
- Learn More
- Get Started
- Book Now
- Sign Up
Note which styles appear most often in high-spending campaigns. This shows you what actually drives conversions, not just engagement.
Most importantly, look at budget allocation across platforms. If competitors are spending 70% of their social ad budget on Facebook and only 10% on LinkedIn, that tells you something about where your audience is most likely to convert.
Turning Competitive Data from Semrush Ad Toolkit Into Media Buying Gold
Most media buyers make the same mistake: they spend hours researching what competitors are doing, then go back to the same old campaigns and wonder why their results don’t improve.
Don’t go into analysis paralysis!
Smart media buyers know how to turn competitor research into actual money.
This section shows you exactly how to turn everything you’ve learned from Semrush into real competitive advantages across every advertising channel.
Expanding Beyond the Big Platforms
So obviously you can use the information you gathered here in Semrush to your campaigns within the same platforms.
But the real money often lies in channels that most competitors haven’t discovered yet! Here are some:
1. Native Advertising Networks
Native advertising companies like Taboola (now under Realize) and Outbrain offer massive reach but need different creative approaches.
Use your AdClarity creative intelligence to see which visual styles and headlines work in your industry, then adapt them for native placements.
2. Other Display Advertising Platforms
The display advertising landscape offers tremendous opportunities for smart media buyers willing to look beyond the obvious choices.
The key is finding top display advertising platforms where your competitors haven’t saturated the market yet.
Good starting points for display advertising platforms are:
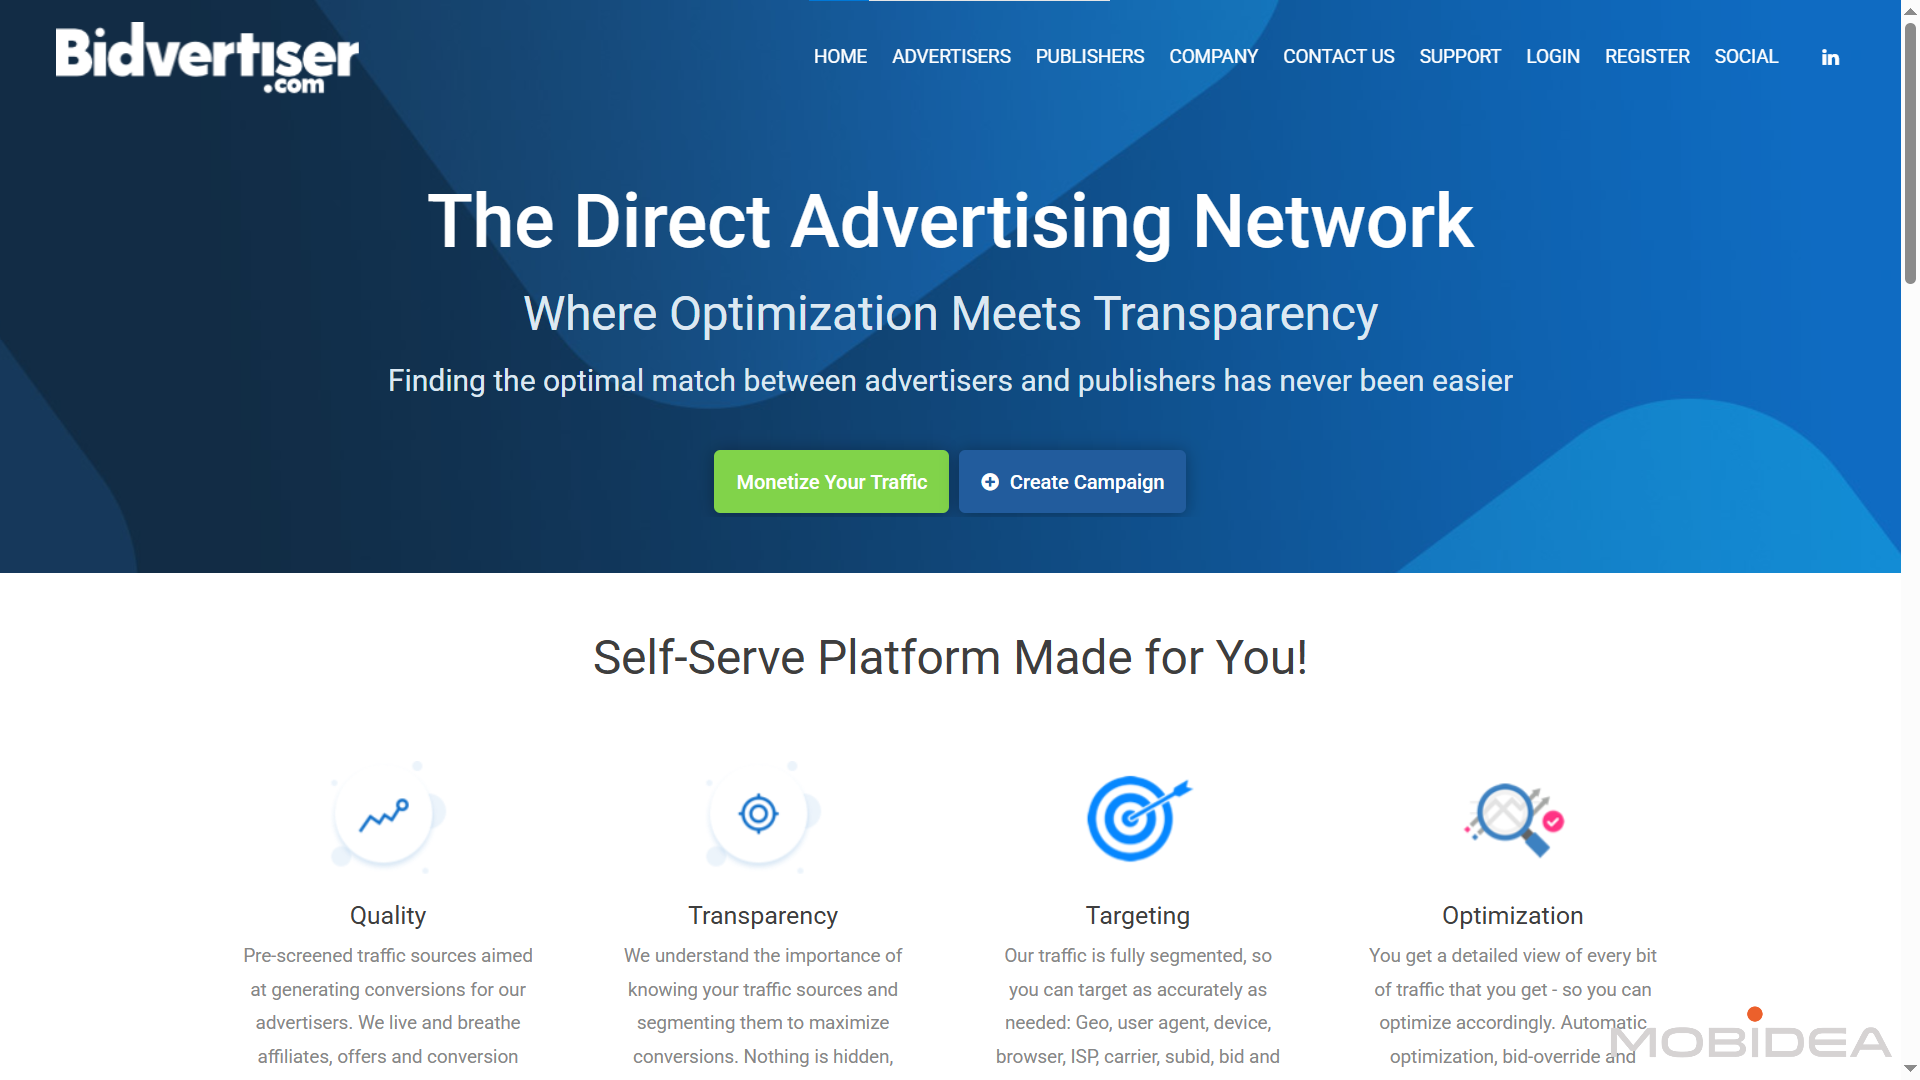
- Bidvertiser: Perfect for beginners with both banner and video ad formats. Offers global reach with competitive rates and accepts most verticals. Their self-serve platform makes it easy to test campaigns quickly.
- Adsterra: Serves over 30 billion monthly impressions from direct publishers across 248 countries and specializes in mainstream traffic with strong performance in apps, utilities, dating, and e-commerce verticals.
- Clickadu: Delivers over 6 billion impressions daily with fraud filtering systems and offers extremely low minimum budgets starting at just $1 daily, making it ideal for testing new creative approaches.
Recommended Reading: Best Banner Ad Networks to Promote Your Offers
3. Industry-Specific Networks
Vertical ad networks are special platforms that focus on specific industries and audiences. They reach fewer people overall but are very good at reaching the exact people you want.
These networks often give you better results and cost less because they really understand their specific audiences.
Here are some examples:
- Healthcare & Medicine Networks: Healthy Ads – Works with over 1,700 websites and shows 2.8 billion ads worldwide, focusing on health, fitness, medicine and pharmaceutical audiences
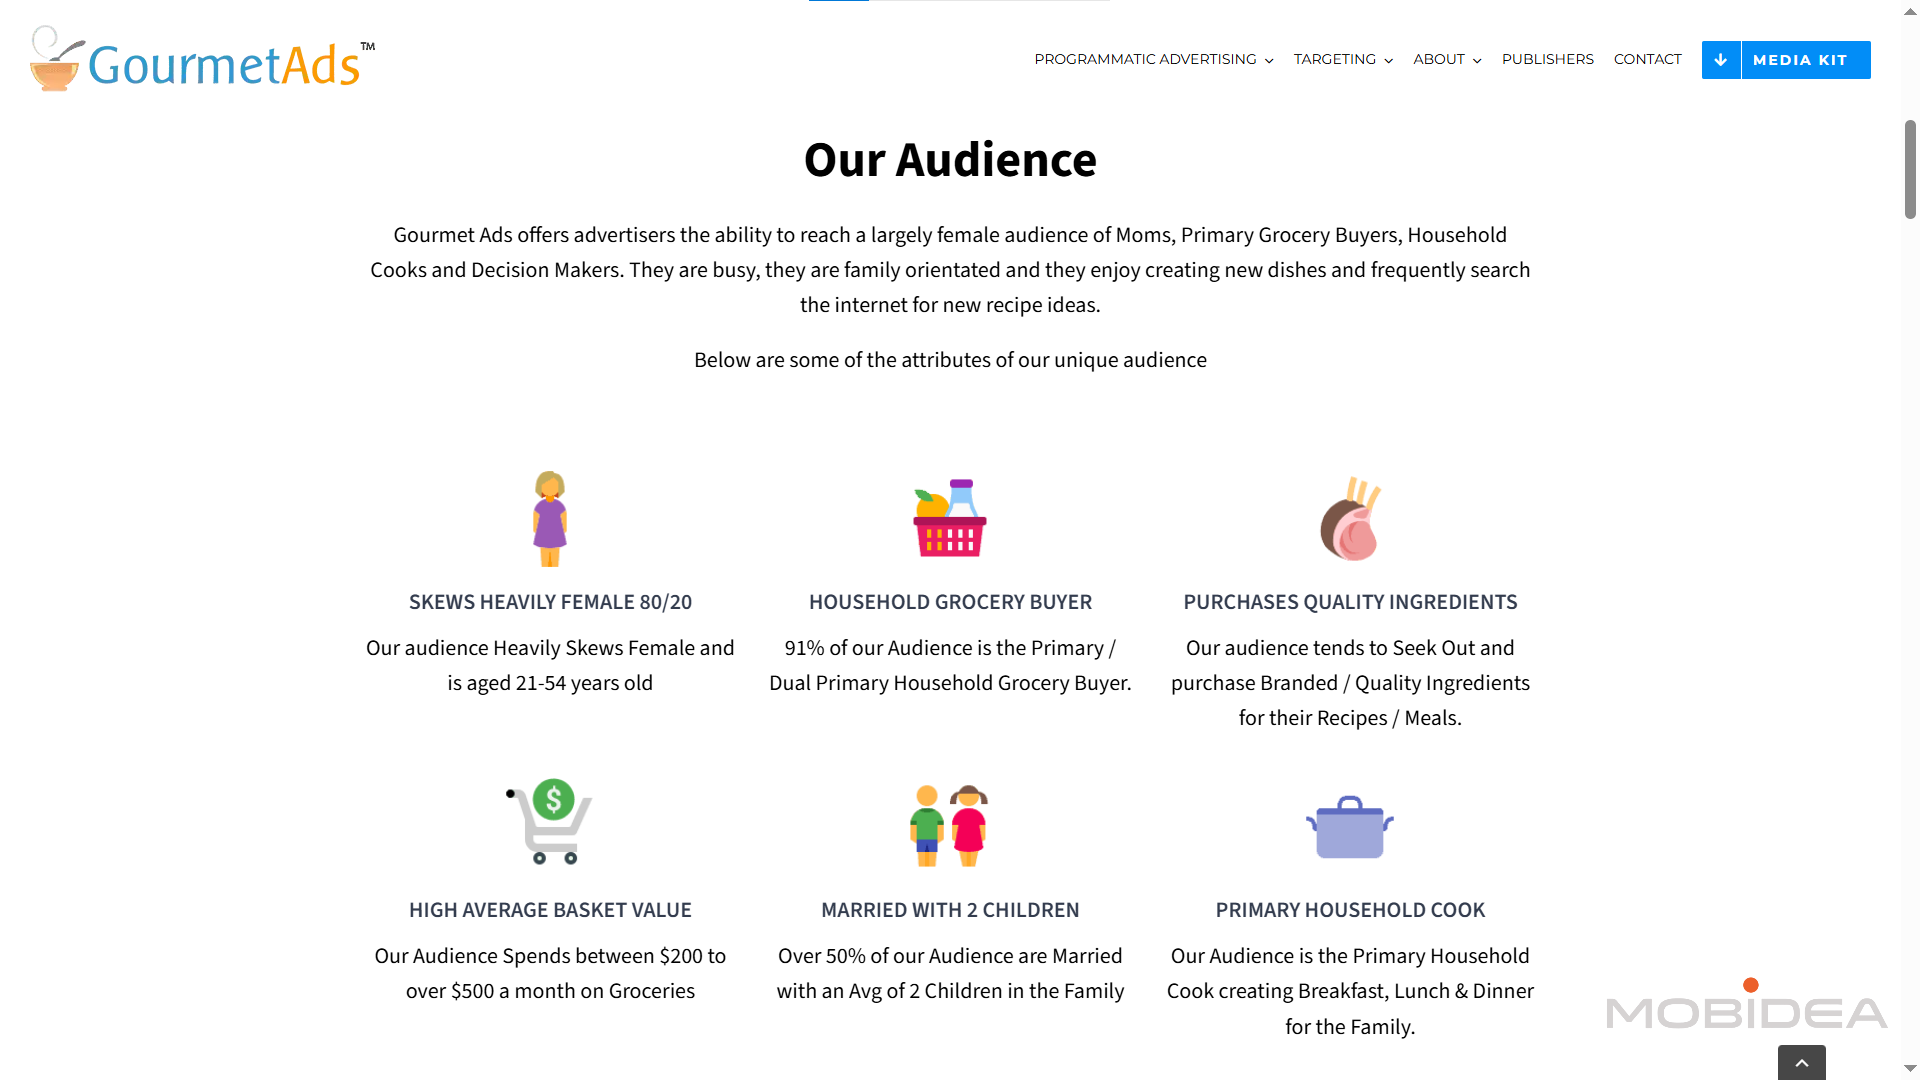
- Food & Cooking Networks: Gourmet Ads – Focuses on food and grocery shoppers, targeting people who visit recipe websites with specific ads for ingredients they might need
Industry-Specific Networks work better because these ads are called “known buys” because you know exactly who will see your ads, unlike bigger networks where you don’t know where your ads will show up.
People in these networks usually have similar interests and needs, making your targeting more accurate and possibly even cheaper in the long run (when computing against CPA and ROI).
Advanced Bidding and Budget Strategies
Now that you have all this competitor data, here’s how to turn it into smart bidding and budget moves that most media buyers miss:
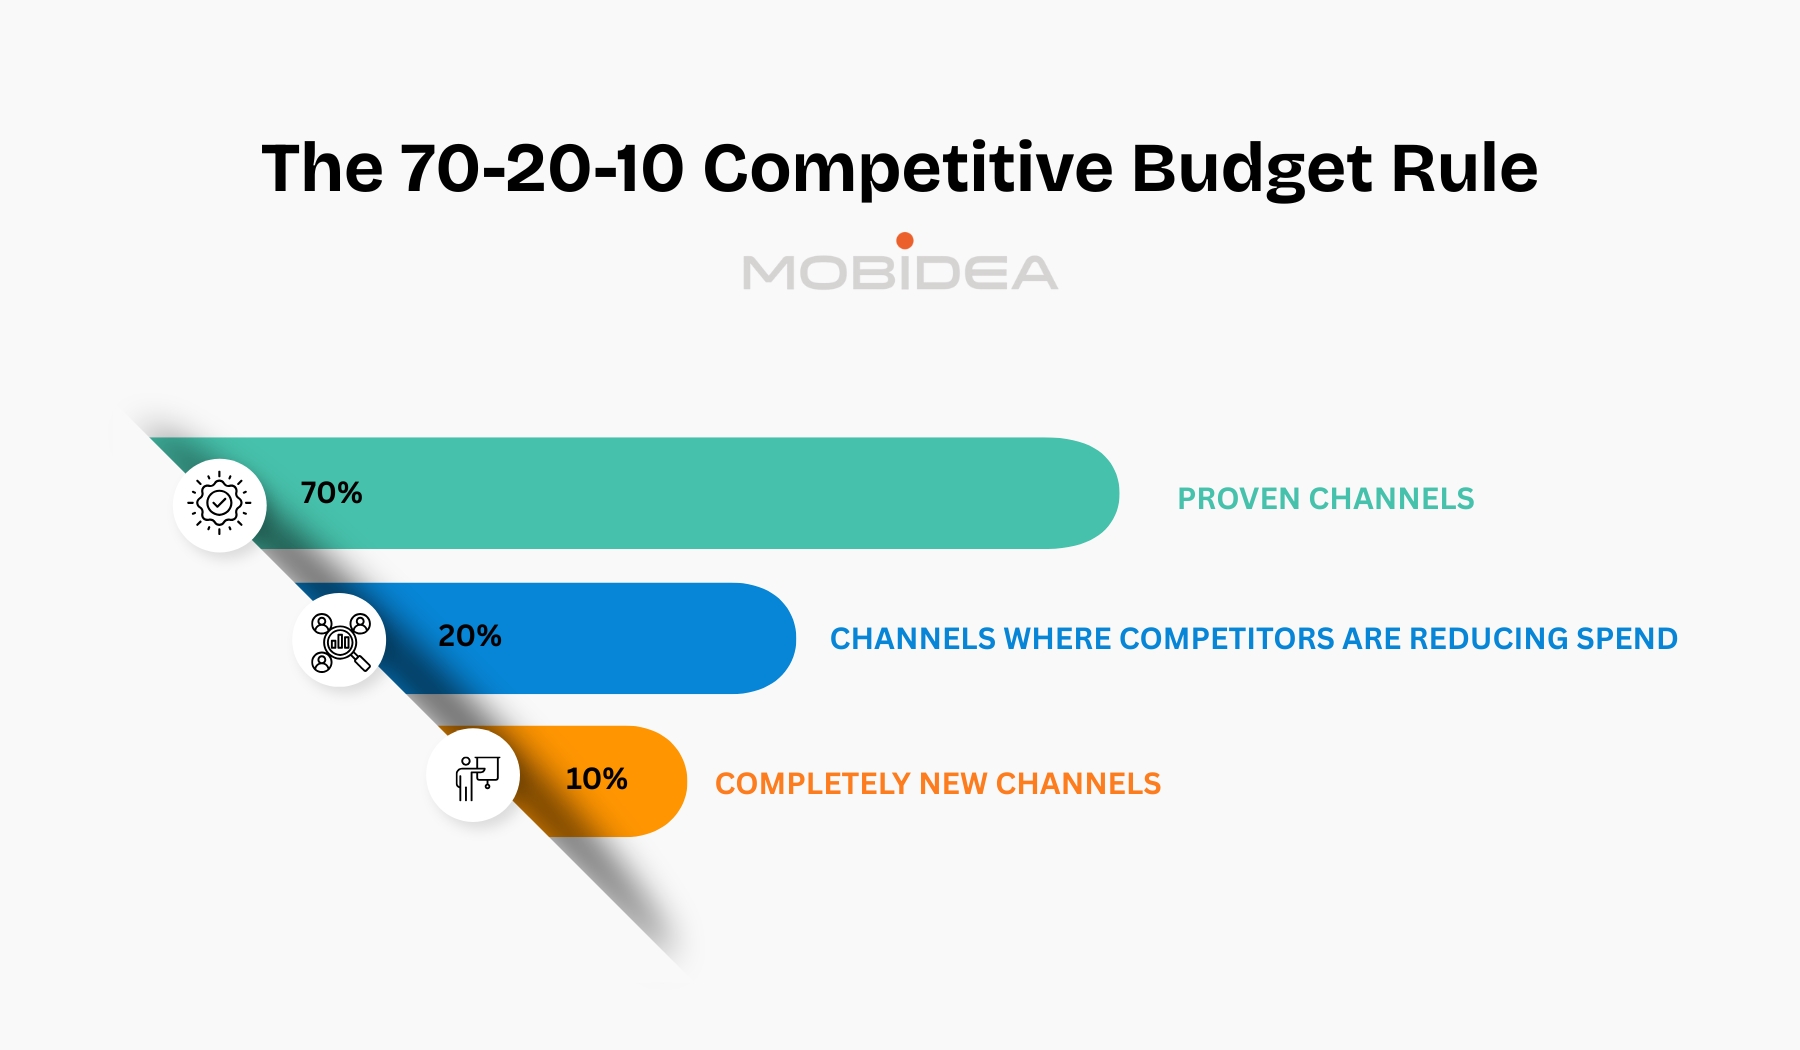
1. The 70-20-10 Competitive Budget Rule
Based on what successful competitors spend across channels, use this breakdown:
- 70% on proven channels where competitors consistently spend big money (these are your safe bets)
- 20% on channels where competitors are reducing spend (opportunity to grab market share cheap)
- 10% on completely new channels competitors haven’t discovered yet
2. Reverse-Engineer Competitor Profit Margins
Here’s a trick most buyers don’t know: You can estimate competitor profit margins using their keyword data.
If a competitor bids $5 per click on “buy running shoes” and stays in position 1-2 for months, they’re probably making at least $15-25 profit per sale. Use this to set your maximum bids – if they can afford $5, you might start at $3-4 and still be profitable.
3. The Gap Bidding Strategy
Look for these specific opportunities in your competitor data:
- Keywords where competitors bid high on weekdays but reduce bids on weekends
- Times when multiple competitors pause campaigns (holidays, industry events)
- Geographic areas where big competitors don’t advertise
Increase your bids during these gaps to capture cheaper traffic when competition is low.
4. Smart Budget Cycling Based on Competitor Patterns
Track when competitors increase or decrease their budgets throughout the year. Then do the opposite:
- When competitors cut budgets (usually January and summer), increase yours to dominate
- When competitors boost budgets (Black Friday, peak season), either match them or pivot to less competitive channels
5. The Creative Longevity Test
Use AdClarity to find ads that competitors have run for 3+ months. These are probably profitable.
Create similar (but not identical) ads and bid more aggressively on them since you know the concept works.
6. Platform-Hopping Strategy
If competitors spend 80% on Google Ads but only 5% on Microsoft Ads, test shifting 20% of your budget to Microsoft.
You’ll often get the same customers at 30-50% lower costs because there’s less competition.
7. Dynamic Bid Adjustments Using Social Intelligence
When Social Tracker shows a competitor’s organic post going viral, immediately increase bids on related keywords.
Viral content creates demand spikes that most buyers miss, giving you cheap traffic while interest is high.
This approach turns your competitor research into actual profit instead of just interesting data.
Ad Creative Development Priorities
Most media buyers waste months testing random creative ideas. Smart buyers use competitor intelligence to fast-track what actually works.
Here are different ways to apply what you’ve learned into your own advertising campaigns:
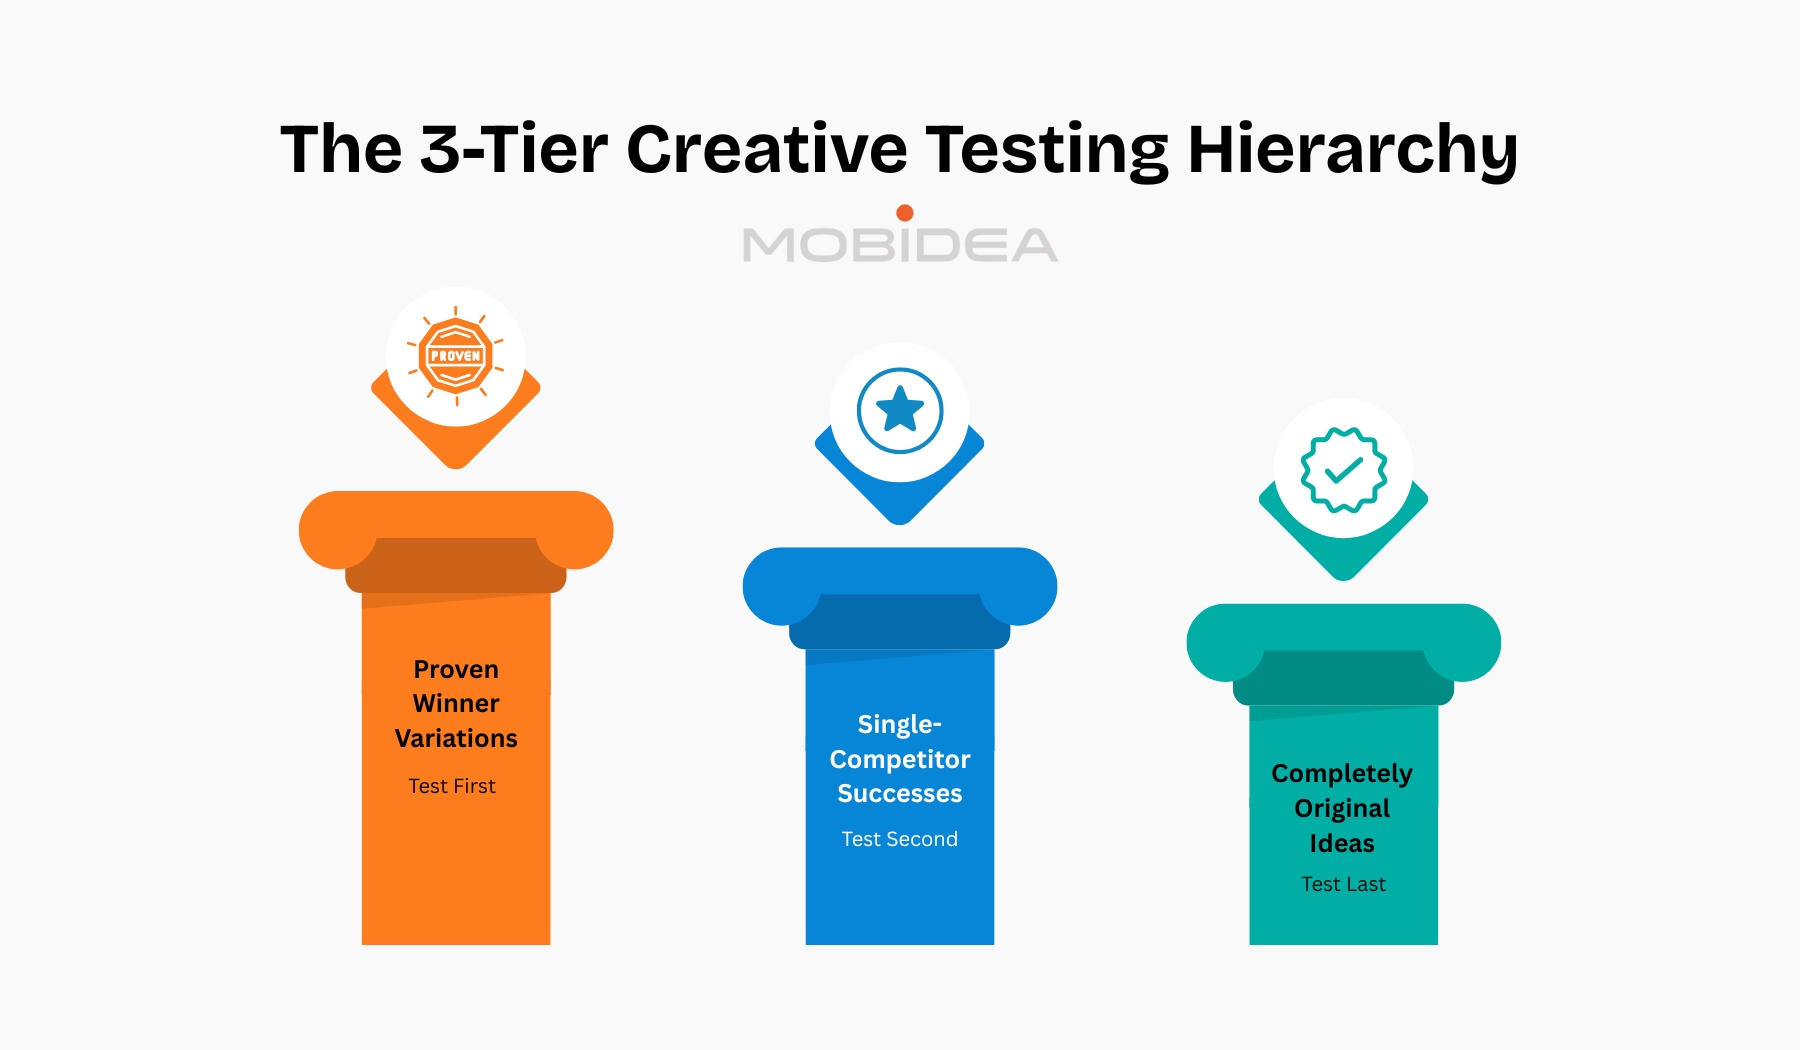
1. The 3-Tier Creative Testing Hierarchy
Tier 1: Proven Winner Variations (Test First)
Find ads that 3+ competitors use with similar messaging or design elements. These are your highest-probability winners. Don’t copy—adapt the core concept to your brand.
Example: If multiple competitors use “before/after” comparison images, test your own before/after format but with different colors, fonts, and your unique value proposition.
Tier 2: Single-Competitor Successes (Test Second)
Ads that only one competitor runs long-term (3+ months in AdClarity). These work but aren’t oversaturated yet. You have a good chance of success with your own version.
Tier 3: Completely Original Ideas (Test Last)
Your creative brainstorms and totally new concepts. These are high-risk, high-reward. Only test after you have Tier 1 and 2 working profitably.
2. The Social-to-Paid Creative Pipeline
Use Social Tracker to spot organic posts with unusually high engagement (5x+ their normal rate).
Turn these into paid ad creatives within 48 hours while the trend is still hot.
Look for:
- Specific phrases that get lots of comments
- Visual styles that get heavy sharing
- Post formats (carousels, videos, single images) that outperform others
3. Platform-Specific Creative Intelligence
For Facebook/Instagram Ads: If competitors’ organic carousel posts consistently outperform single images, prioritize carousel ad formats.
Check what image ratios (square, vertical, horizontal) get the best engagement in Social Tracker.
For Google Display: Use AdClarity to find banner sizes that competitors use most often on high-traffic websites.
If everyone uses 728×90 banners on news sites, that size probably converts best for your industry.
For YouTube Ads: Check competitor video lengths in AdClarity’s video section.
If most successful video ads are 15-30 seconds, don’t create 2-minute videos as your first test.
4. The Message Extraction Method
Don’t just copy competitor headlines—extract the psychological triggers:
| Observation | Action |
| Competitors use “Limited Time” | Test other urgency triggers like “Only 50 Left” or “Ending Soon” |
| Competitors use social proof like “Join 10,000+ customers” | Test authority proof like “Trusted by Fortune 500 companies” |
| Competitors focus on price | Test value-focused messages instead |
5. Creative Refresh Strategy Using Competitor Data
Set up alerts in AdClarity for when competitors launch new creative campaigns.
When a competitor tests a new visual style or message angle for 2+ weeks, they’re probably seeing good results. Create your version immediately.
6. The Cross-Channel Creative Multiplier
When you find a winning creative approach on one platform, adapt it for others:
| Observation | Action |
| Static display banner designs | Static display banner designs |
| Facebook video ad openings | Facebook video ad openings |
| High converting search ad headlines | Social media ad primary text |
Ready to Stop Guessing and Start Winning?
Every day you delay using competitor intelligence, your competitors get further ahead with better keywords, smarter budgets, and proven creative approaches.
Semrush’s advertising toolkit gives you everything you need to catch up and overtake them, but only if you actually use it.
Start with a free Semrush trial today and pick your biggest competitor to analyze first. Your next profitable campaign is hiding in their strategy right now.


Best anti-detect browsers to bypass bans, protect privacy, and manage multiple accounts. Stay ahead in affiliate marketing—read more!

Boost affiliate profits with Valentine’s Day offers! Learn top verticals, GEOs, and ad strategies to maximize conversions.

How can you easily find winning keywords, create better ads, and bid smarter than the competition? Easy—use Semrush's Advertising Toolkit!